On November 8, 2022, trading conditions across major cryptocurrency exchanges changed dramatically. The move began around 2 a.m. UTC, as initial signs of trouble at FTX became visible. Spot volume for Bitcoin against Tether (USDT) and USD Coin (USDC) jumped to its highest levels since the downturn of May 2021.
A closer look at the data later revealed an interesting detail that much of the activity came from relatively small market orders rather than large institutional trades. The same dynamic surfaces repeatedly, as conditions worsen, the retail crowd pivots fast to perceived safe havens. Trade-level data, on-chain movement, and the cadence of headlines all trace the same flight.
Superimposed, they reveal something close to an anxiety heatmap for crypto, not a model, but a direct imprint of collective risk-off moments and the rush for shelter within the digital asset environment.
The anxiety heatmap is not a unique proprietary visualization, it is a framework for analysis that combines three publicly available data sets.
1. Exchange-level trade data
Tick-level trading data from centralized exchanges is available through several crypto data providers, among them are Kaiko, CryptoQuant, and The Block. If you filter BTC/stablecoin trades by small transaction sizes (usually under $10k) and market orders, you can zero in on smaller, less patient traders. It’s a rough proxy for retail investors, but statistically it holds up. Kaiko’s research has repeatedly shown that during market stress, the share of market orders in spot BTC/USDT volume rises sharply, indicating urgency to exit at any price.
For example, during the LUNA collapse in May 2022, the BTC/USDT buy-sell ratio on major exchanges dropped to 0.83, but what was more telling was the spike in retail-sized sell orders within hours of the UST depeg.
2. On-chain exchange net flows
Platforms like Glassnode and CoinMetrics track the net amount of Bitcoin moving into and out of exchange wallets. A large inflow of BTC to exchanges typically signals selling intent. High Bitcoin inflows to exchanges often point to an intention to sell, so the link between those inflows and a subsequent spike in BTC-to-stablecoin volume becomes much tighter during market panics.
3. Stablecoin supply movements and velocity
When crypto market participants flee to safety, the circulating supply of stablecoins on exchanges swells. CryptoQuant’s exchange stablecoin ratio, the amount of Bitcoin reserves divided by stablecoin reserves on spot exchanges, often plummets.
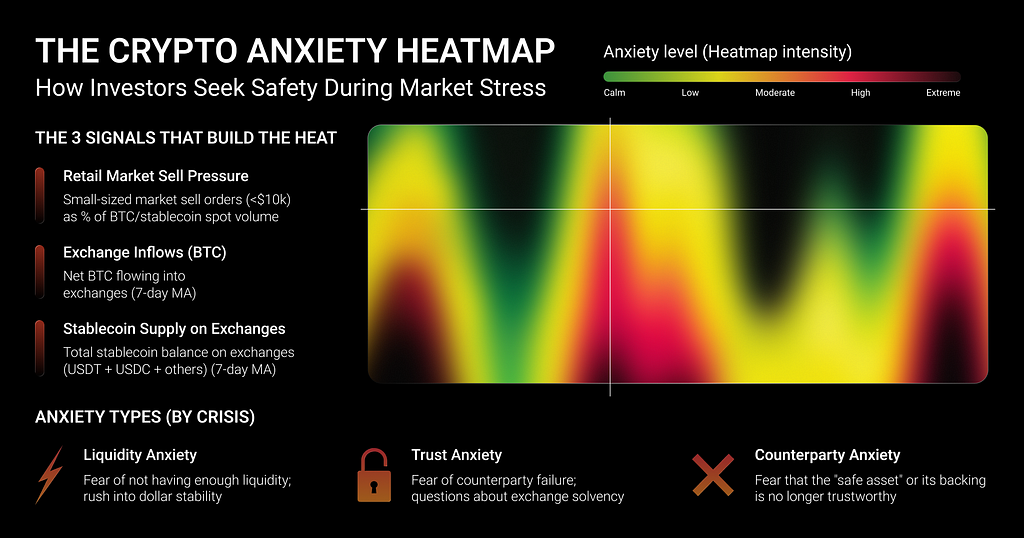
Taken together, these three data layers, small-sized market sells, exchange inflow spikes, and stablecoin reserve surges, form the hot zones on the anxiety heatmap.
In practice, the heatmap tends to light up when three signals appear simultaneously:
Individually, each metric can be noisy but together, they provide a useful real-time proxy for rising investor anxiety.
While the trigger changed from crisis to crisis, the behavioral response remained remarkably consistent. Each episode illuminated a different form of investor anxiety, helping reveal how the crypto anxiety heatmap transformed over time.
The sell-off started on March 12 when the pandemic announcement came, and Bitcoin fell 52% by the following day, closing near $3,800 after starting around $7 ,900.
Chainalysis later reported 1.1 million BTC hitting exchanges across eight days. On March 13 alone, the figure stood at roughly 319,000 BTC, about nine times the usual daily volume before the crash. For comparison, that was around nine times the normal daily figure before the sell-off began.
This surge clearly suggested that market participants were moving assets onto trading venues in preparation for sale rather than long-term storage.
Faced with a sudden global liquidity shock, investors across asset classes sought access to dollar-denominated liquidity. Analysis from The Block later showed that stablecoin balances on exchanges expanded significantly following Black Thursday as traders increasingly moved capital into digital dollar instruments.
Anxiety Type: Liquidity Anxiety
This was the first major demonstration that stablecoins could function as a crisis hedge inside the crypto space. Investors did not simply exit risk assets, many sought immediate dollar exposure without returning to traditional banking rails.
The FTX collapse in November 2022 exposed a different kind of market fear and earlier episodes had been tied to macro shocks. This one was triggered by the failure of a major industry institution, and the anxiety heatmap reflected the turn clearly.
On November 2, CoinDesk published an investigation into Alameda Research. Its balance sheet, according to the report, relied heavily on FTT, a token issued by FTX itself. The disclosure drew attention to the financial ties between the two entities. Solvency questions around the wider group followed quickly.
Customers pulled funds at an accelerating pace over the next several days. By November 11, the bankruptcy had swallowed FTX, Alameda Research, and about 130 affiliated entities, all seeking Chapter 11 protection.
Market volatility and falling prices were no longer the main worry. Trust in centralized exchanges had become the larger question, specifically, whether customer funds were safe. Across the digital asset industry, firms began recalculating the risk of leaving assets with third parties.
Anxiety Type: Trust Anxiety
Earlier sell-offs had been caused by price action, but the FTX collapse was different, so it was a trust crisis first. The question was no longer how low Bitcoin might go, investors wanted to know if their funds were actually safe sitting on centralized exchanges.
In March 2023, Silicon Valley Bank, a key financial node for the technology and startup sectors, was shut down by regulators. The event triggered a response that extended past conventional banking, and the heatmap reflected the reconfiguration.
Soon afterward, Circle Internet Financial disclosed that approximately $3.3 billion of the reserves backing USDC were held at SVB and had become temporarily inaccessible. The revelation immediately raised concerns about whether USDC could maintain its one-dollar peg.
Within hours, USDC fell as low as approximately $0.88 on some trading venues, marking the largest deviation from its peg in the stablecoin’s history. Investors rushed to reassess counterparty risk, not only within crypto markets but also within the traditional banking infrastructure supporting digital assets.
As faith in USDC began to falter, capital rotated quickly into other dollar-denominated instruments, USDT, as well as vehicles backed by short-term Treasuries, highlighting a reality that the episode laid bare. A stablecoin’s perceived safety rests, in the end, on the credibility and resilience of the institutions that hold its underlying reserves.
The incident underscored a basic fact that a stablecoin’s stability depends, above all, on the institutions that protect its reserves and on whether those institutions are seen as credible.
Anxiety Type: Counterparty Anxiety
This was the first major crypto panic in which the safe-haven asset itself became the source of fear. During earlier crises, investors typically fled into stablecoins. During the USDC depeg, investors questioned whether a digital dollar was actually worth a dollar.
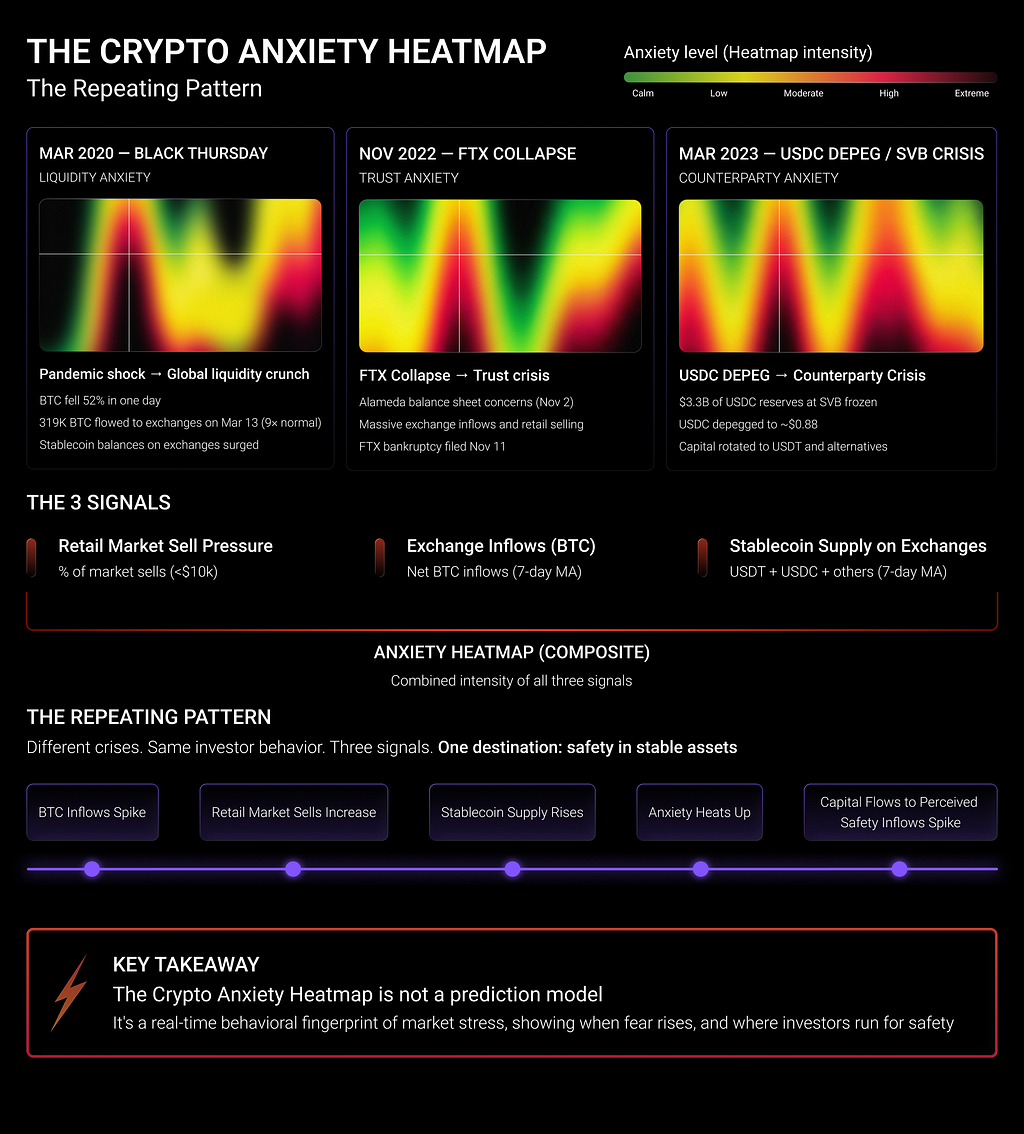
Crypto markets have absorbed three very different shocks, but the reaction has been nearly the same each time. In 2020, the dominant fear was a liquidity squeeze. In 2022, it was an institutional failure. By 2023, investors had started doubting the safety of stablecoins themselves.
Yet whenever uncertainty spiked, capital migrated to whatever corner of the digital-asset ecosystem seemed least exposed. Exchange inflows rose, retail selling intensified, stablecoin demand jumped are all signals that kept appearing before or during the worst moments of stress. Pulled together, they form something like a crypto anxiety heatmap: a view not just of when investors panic, but of where they go looking for safety once confidence begins to crack.
The Crypto Anxiety Heatmap: How Investors Seek Safety During Market Stress was originally published in Coinmonks on Medium, where people are continuing the conversation by highlighting and responding to this story.

