
On Sunday, March 29, Celestia (TIA) is still experiencing pressure in the market. The trading volume has been declining, and the overall sentiment remains bearish. This continuous trend suggests that selling interest continues to dominate price action.
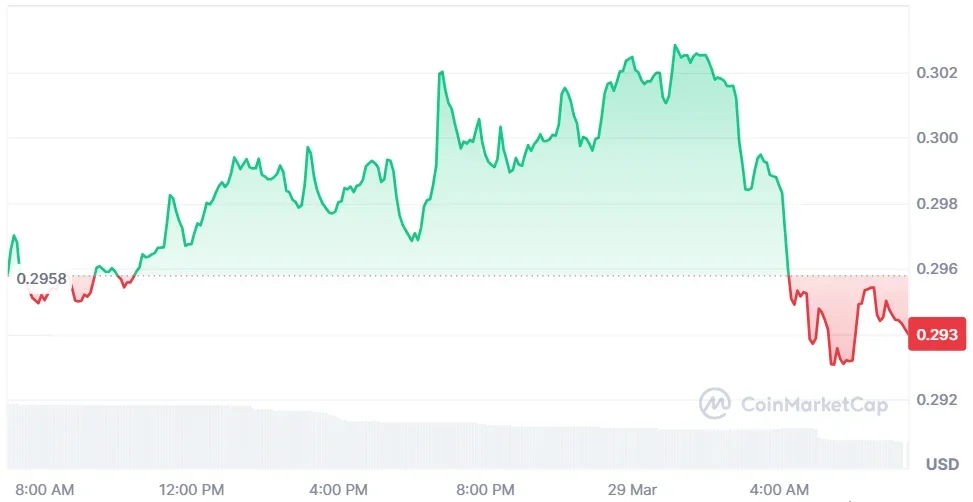
As of writing, Celestia (TIA) is trading at $0.2942, showing a drop of 0.43% in the past day. The trading volume has declined by 55.71% and is currently standing at $14.9 million. Over the past week, the price of TIA has decreased by 9%, according to CoinMarketCap.
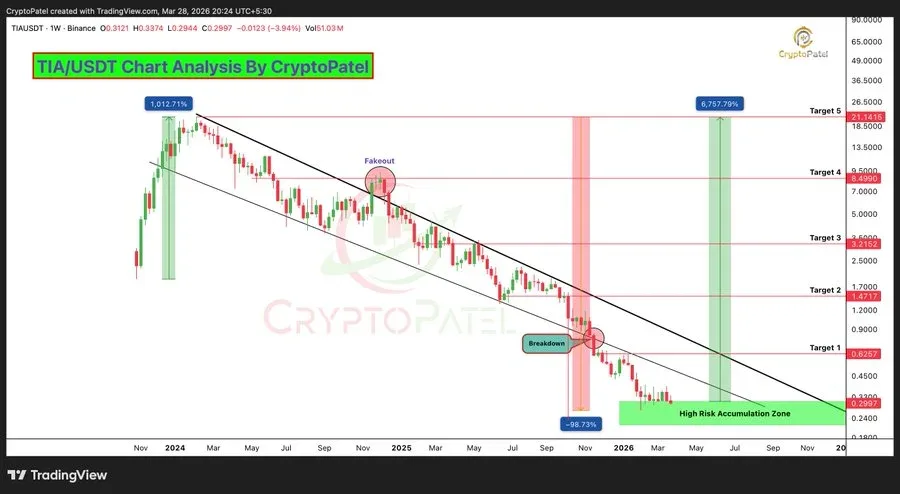
Analyst Crypto Patel highlighted that the current zone is critical for TIA. He noted that the token has lost 98.73% of its all-time high above $21. Currently, it is trading below a macro descending parallel channel. This places the token in an extreme value zone.
Patel referred to past market cycles for comparison. The same patterns were present before a reversal. However, confirmation is still pending. TIA needs to close and hold above $0.63 for a bullish change of character.
Analysts also outlined the possible targets for a price increase. The targets include $0.60, $1.47, $3.2, $8.4, and $21. However, there is a downside risk as well. A close below $0.20 will negate the bullish pattern. This level is now seen as a key support level.
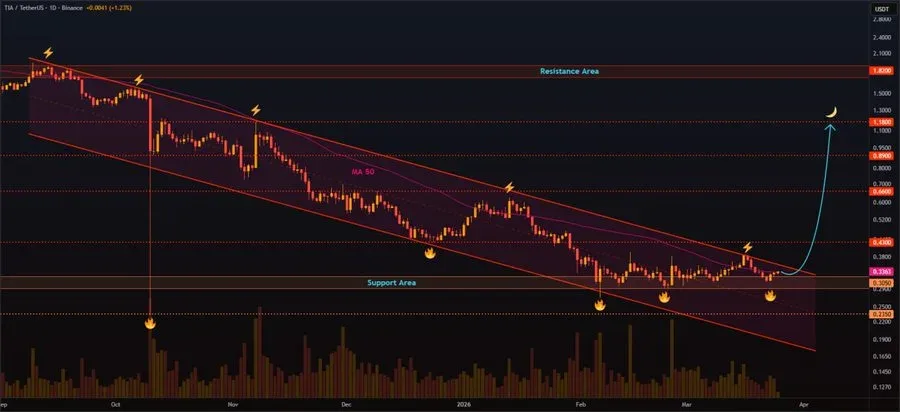
Moreover, another expert, Ari Zaim, revealed that TIA is pushing against descending channel resistance. The analyst noted that consolidation is almost complete. There is a slow build-up of momentum.
Also Read: ONDO Holds $0.24 Support While Ondo Perps Unlocks Powerful 20x Trading
A breakout will confirm a trend change. The analyst also listed near-term price targets of $0.43, $0.66, $0.89, and $1.18. These will depend on a confirmed breakout above resistance. Until then, the price remains in a waiting phase.
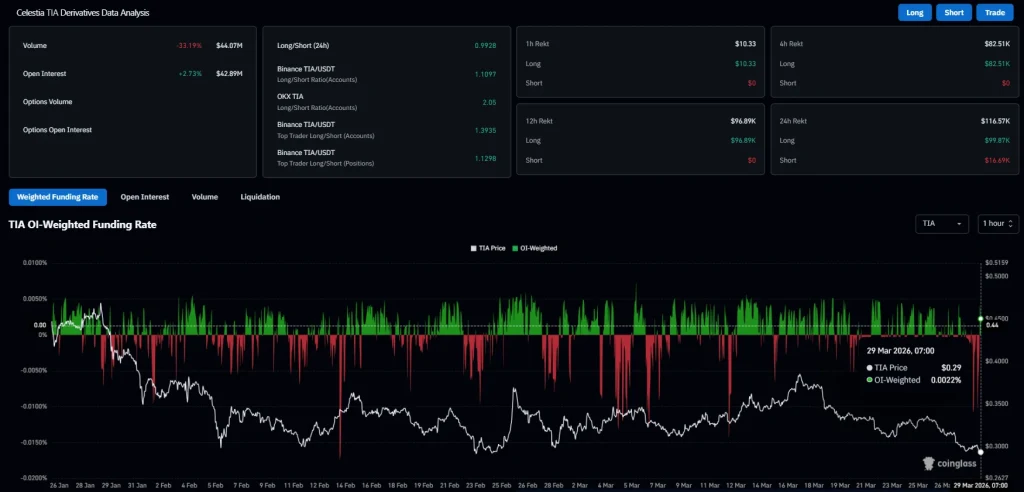
CoinGlass data shows that the future volume is down by 33.19% to $44.07 million. Meanwhile, the open interest is up by 2.73% to $42.89 million. The OI-weighted funding rate is at 0.0022%, showing that traders slightly favor long positions.
From a technical perspective, the Relative Strength Index (RSI) indicates further weakness. The RSI is currently at 36.69, which is still below the 50 mark. This is a bearish indication. The moving average of the RSI is 46.18, and it has been declining, which shows no sign of reversal.
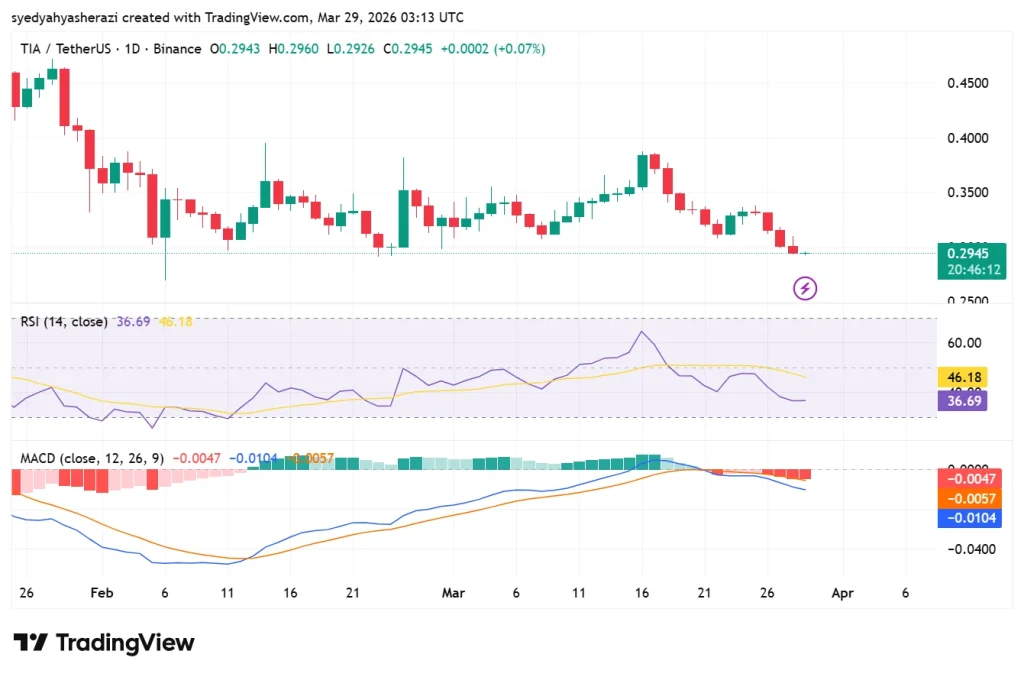
The Moving Average Convergence Divergence (MACD) indicator also reflects a bearish trend. The MACD line is at -0.0104, remaining lower than the signal line at -0.0057, indicating a strong negative trend.
This article contains market analysis and price predictions. These are not guarantees. Crypto markets are volatile. Always DYOR. Not financial advice.
Also Read: Celestia Accumulation Zone Hints at an Explosive Rally Toward $21


