
On Sunday, March 29th, Hyperliquid (HYPE) experienced price stability as traders focused on resistance and support price levels. Market participation indicated a cooling effect, but the price still managed to hold its gains. The short-term sentiment remained positive.
As of writing, Hyperliquid (HYPE) is trading at $39.32, marking a 3.07% increase in a day. The trading volume is down by 24.99% and is currently standing at $180.12 million. Over the last week, the HYPE coin price has gone up by 0.73%, according to CoinMarketCap.

Analyst Emilio Crypto Bojan highlighted that HYPE may be gearing up to move again. He pointed out that the inverse head-and-shoulders formation has been completed.
The focus point still remains at $40.30. This must be broken to confirm the move. Otherwise, momentum could slow.
Currently, the market positioning favors the bulls. Long positions dominate with around 70% share. This suggests that the market is in favor of continuing the trend. Analysts, however, caution that the open interest must still be high. Otherwise, the trend may not hold up.
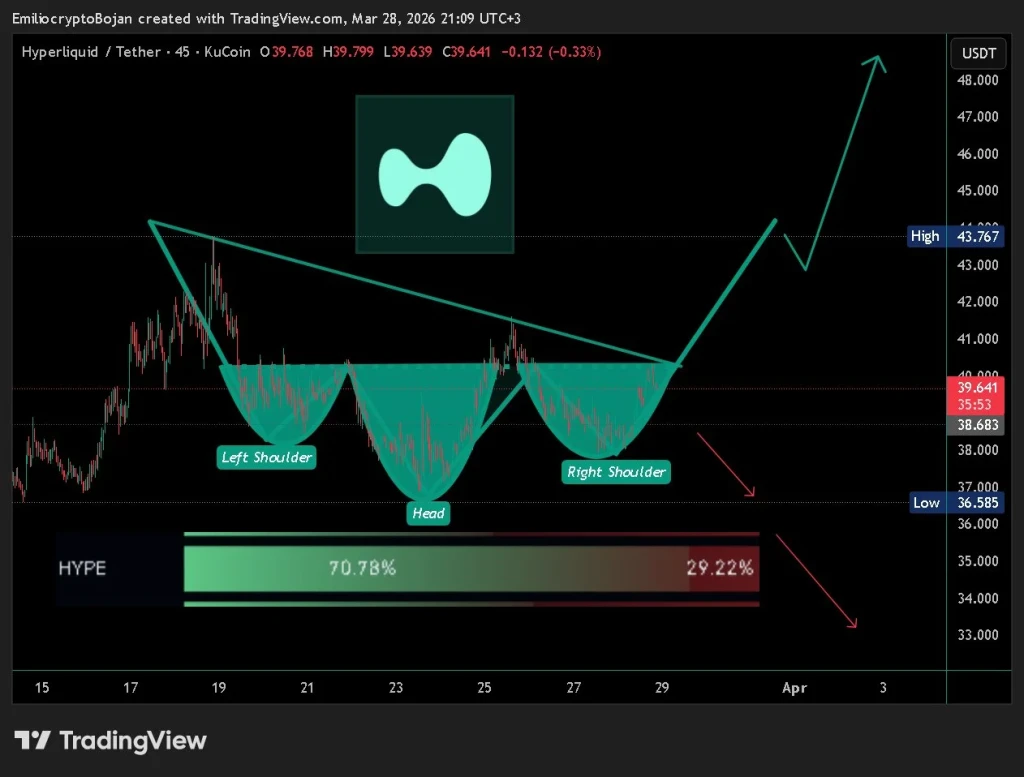
The risk levels are still well-defined. If the price drops by $38, it may indicate a bearish trend in the market. This may cause HYPE to move to the range of $33 to $35.
In addition, another analyst, CryptoCeek, mentioned the strong support levels at $36.70 and $37.60. This is still an important area for the bulls.
Also Read: Hyperliquid (HYPE) Psychological $40 Level Could Shape the Rally Above $45
The resistance point is at $43.70. A decisive move past this point could pave the way for a move to $50. A failure to hold support could lead to a fall to $33. Analysts point out that HYPE is still holding its structure.

CoinGlass data shows a fall in volume by 15.27% to $947.94 million. However, open interest has risen by 3.28% to $1.70 billion. The OI-weighted funding rate is at 0.0029%. This suggests a slight bullish bias in leveraged positions.

Short-term trend indicators show support below the price. The 20-day EMA sits at $37.985, and the 50-day EMA is currently at $34.850. The price remains well above both of these levels, indicating a strong uptrend from a buying perspective.
Long-term indicators also show stability. The 100-day EMA is at 33.272, and the 200-day EMA is at 33.382. These are well below the current price. This shows a solid base in higher timeframes and confirms the trend.
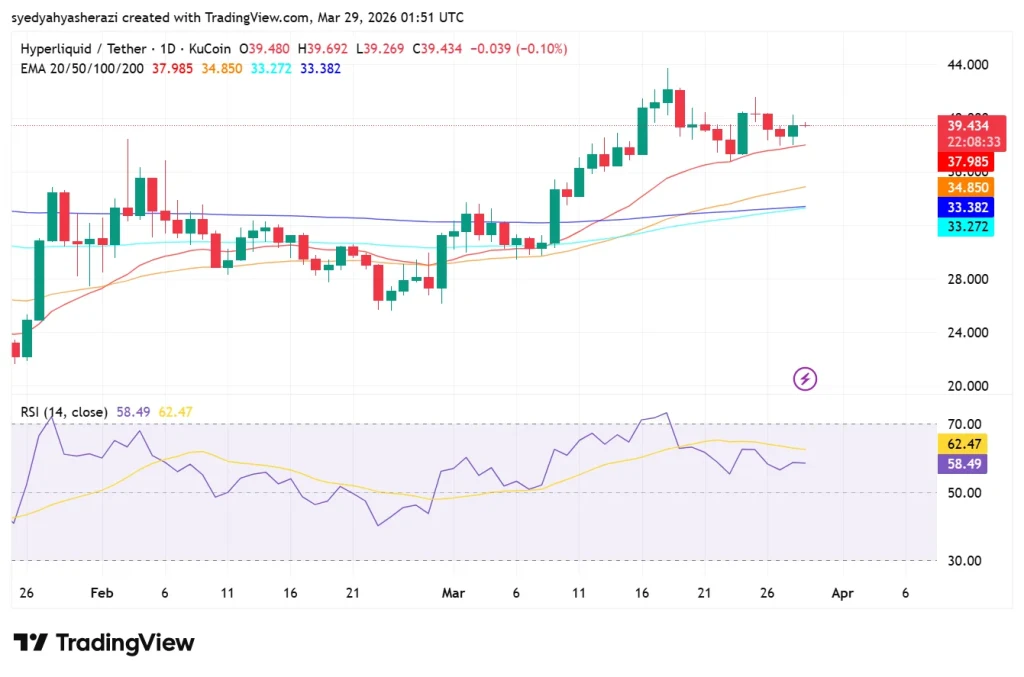
The Relative Strength Index (RSI) is at 58.49, and its moving average is at 62.47. This places cryptocurrency in a neutral to bullish zone. The token still has room to move up without entering the overbought region.
This article contains market analysis and price predictions. These are not guarantees. Crypto markets are volatile. Always DYOR. Not financial advice.
Also Read: Hedera (HBAR) Rises as Buyers Step In: Is a Move Toward $0.30 Next?


