
On Tuesday, March 24, RENDER drew renewed attention as an analyst highlighted a chart pattern that resembles its previous price rally. The asset is trading near a high-timeframe demand zone that could dictate its next move.
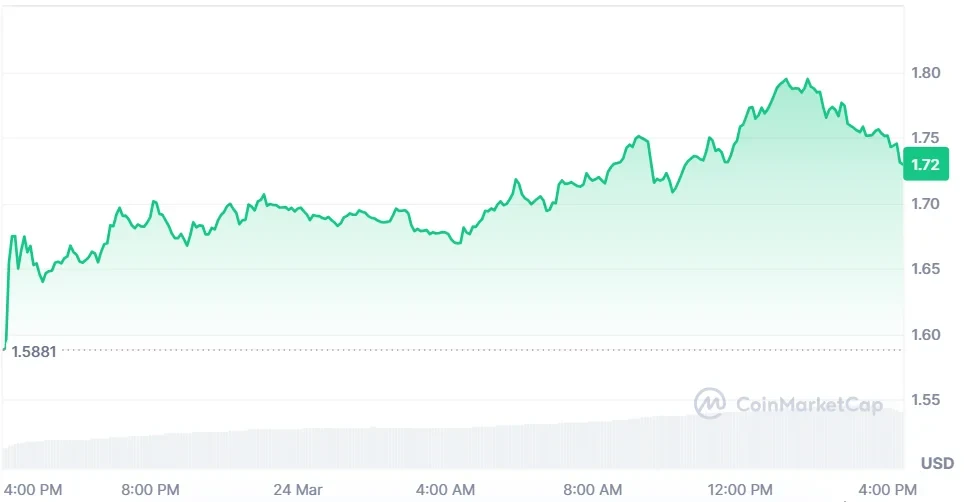
As of writing, RENDER is trading at $1.72, marking a 4.79% uptick in the past 24 hours. The trading volume is showing a strong bullish surge up 117.89% and is currently standing at $108.45 million. Over the last week, the token price has decreased by 8.01%, according to CoinMarketCap.
Analyst Crypto Patel highlighted that a similar structure to the previous one that led to a significant rally might be in play for RENDER. He noted that the token is currently in a high-timeframe bullish order block after a significant drawdown of about 90% from its all-time high.
The analyst identified the previous high at $13.83. He said that the coin is now in a long corrective range after that high. The chart also shows a descending channel compression on a multi-year timeframe near demand.
The key high timeframe bullish order block is between $1.35 and $1.10. He also drew a 0.786 Fibonacci level at $0.845, which is an optimal zone for accumulation. Patel further added that there is a possibility of a liquidity grab in the market before any expansion, which is below $1.
He stated that the bullish outlook is valid so long as the price holds above $0.845 on the higher timeframe close. A close below that level will weaken the structure. Patel identified $0.845 as a key level on the chart.
Also Read: RENDER at the Crossroads: Is $2.16 the Gateway to a New Bull Cycle?
The analyst also made a comparison with the previous cycle of the token. He said RENDER saw a 5,000% gain from $0.274 to $13.83 during the 2022 to 2023 period.
On the other hand, the period from 2024 to 2026 has been a corrective accumulation period so far. The longer decline has pushed the price back to a major demand zone.
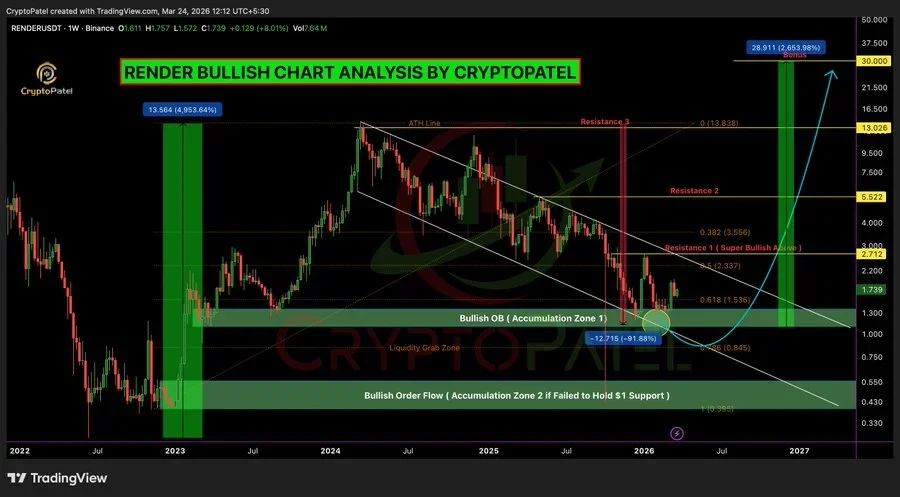
Patel identified major high-timeframe demand zones, which are between $1.35 and $1.00. If this fails, then the next support is at $0.60 to $0.40.
For upside confirmation, the analyst said that RENDER needs to break the $2.71 mark. This level represents the breakout point for the descending channel. If the bullish pattern continues to build, Patel listed targets at $2.70, $5.50, $13.00, and beyond $28.
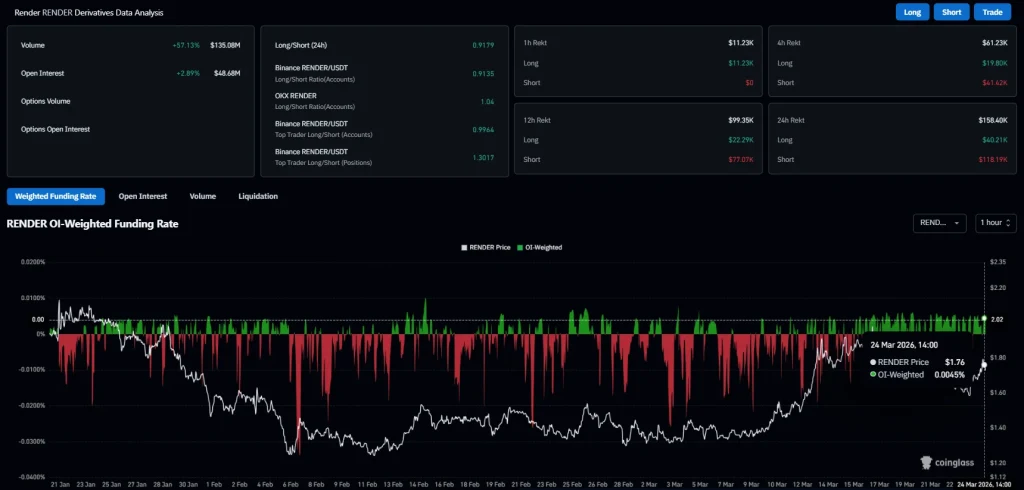
According to CoinGlass data, derivatives volume increased by 57.13% to $135.08 million. The open interest rose by 2.89% to $48.68 million. The OI-weighted funding rate is at 0.0045%, showing slightly positive positioning.
This article contains market analysis and price predictions. These are not guarantees. Crypto markets are volatile. Always DYOR. Not financial advice.
Also Read: Cardano (ADA) Investors Losing 43% – Ultimate Buy Opportunity?

