ONDO/USDT reclaimed $0.40 and flipped its daily structure bullish, but a fresh hourly reversal off $0.42 says the next few candles matter more than the trend line does.
Somewhere around $0.31, ONDO stopped falling. Nobody rang a bell for it. The token had spent about six weeks grinding sideways in the low thirties after getting cut roughly in half from its May spike toward $0.49, and then, without much fanfare, it turned.
By July 23 price is sitting near $0.404, up from that base by more than 25%. The move looks clean on paper. Whether it holds is a separate question, and the three charts below don’t all agree on the answer.
ONDO’s daily chart tells a story of two very different quarters. The token cratered from a January high near $0.47 down toward a wick low around $0.1855, spent March and April carving out a rough floor between $0.24 and $0.28, then launched into a violent May rally that peaked just under $0.49. Everything since has been giving pieces of that back.
June ground the price down to the $0.31 to $0.32 area, a zone that’s now acting as the higher low in a longer basing structure. What changed the picture was the reclaim. Price broke back above $0.35, then $0.40, in a move sharp enough to count as a bullish change of character on the daily timeframe. That doesn’t erase the supply sitting overhead near $0.44 to $0.465, the same zone that capped every bounce back in June.
Source: TradingView, Binance data (ONDO/USDT, Daily), chart via tradingview.com/chart/z0EwKq6I
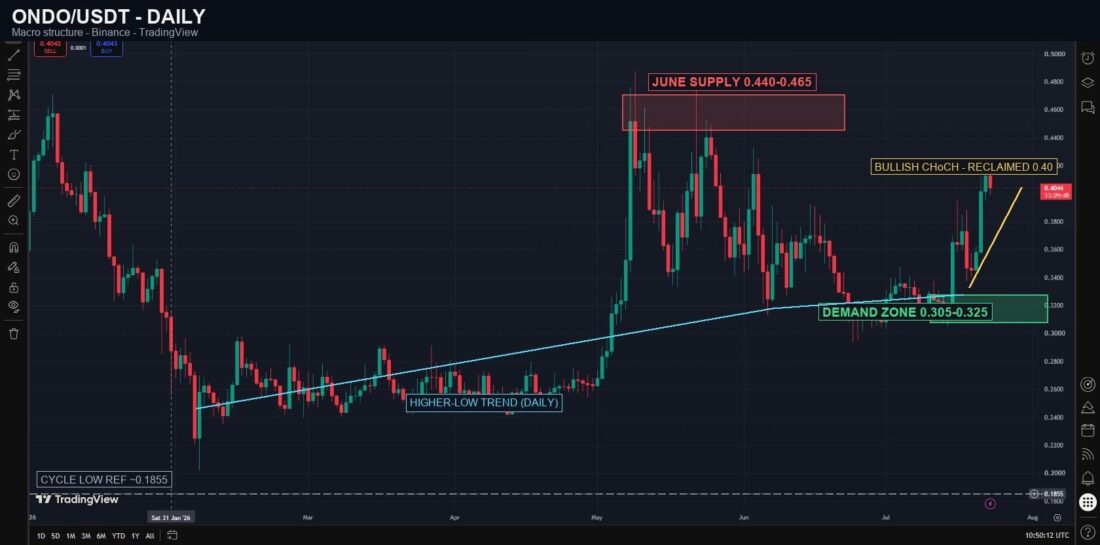
ONDO/USDT Daily chart. Source: TradingView / Binance.
Zoom into the four-hour and the higher-low sequence is almost textbook. Lows print at $0.298, then $0.312, then $0.335, then $0.345, each one higher than the last, with a break of structure confirming somewhere after every leg. The base that formed around $0.343 to $0.362 in mid-July is doing double duty now, both the launchpad for the second impulsive leg and the level bulls would need to defend if this pulls back further than people expect.
A similar tug-of-war just played out on XRP, where a sweep below a round-number level gave way to a fast reclaim and a multi-day base before the short-term trend flipped, something Live Bitcoin News covered in detail this week. ONDO’s version has the same shape. Higher highs at $0.34, then $0.39, then $0.42, stacked over about ten days, and the supply zone up at $0.412 to $0.425 is the next real test.
Source: TradingView, Binance data (ONDO/USDT, 4H), chart via tradingview.com/chart/z0EwKq6I
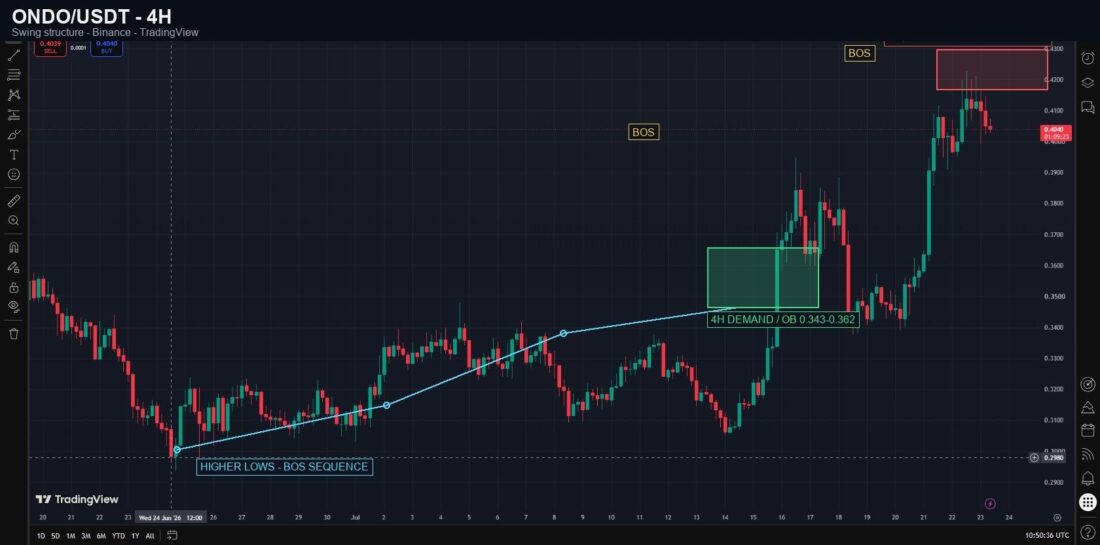
ONDO/USDT 4H chart. Source: TradingView / Binance.
Here’s where it gets messier. Drop down to the one-hour and ONDO peaked near $0.421 and has been printing lower highs since, $0.417, then $0.414, then down toward $0.404 where it’s sitting now. That’s a bearish change of character forming on the smallest timeframe, right at the exact level the bigger picture needed to hold.
It isn’t a breakdown yet. The $0.393 to $0.407 band below current price is the retest zone from the last leg up, basically the last line of defense before sellers get control of the short-term tape. Below that sits the $0.343 to $0.352 pocket where a liquidity sweep on July 18 flushed out late longs before the rally even started, still an open level if things get ugly again.
Source: TradingView, Binance data (ONDO/USDT, 1H), chart via tradingview.com/chart/z0EwKq6I
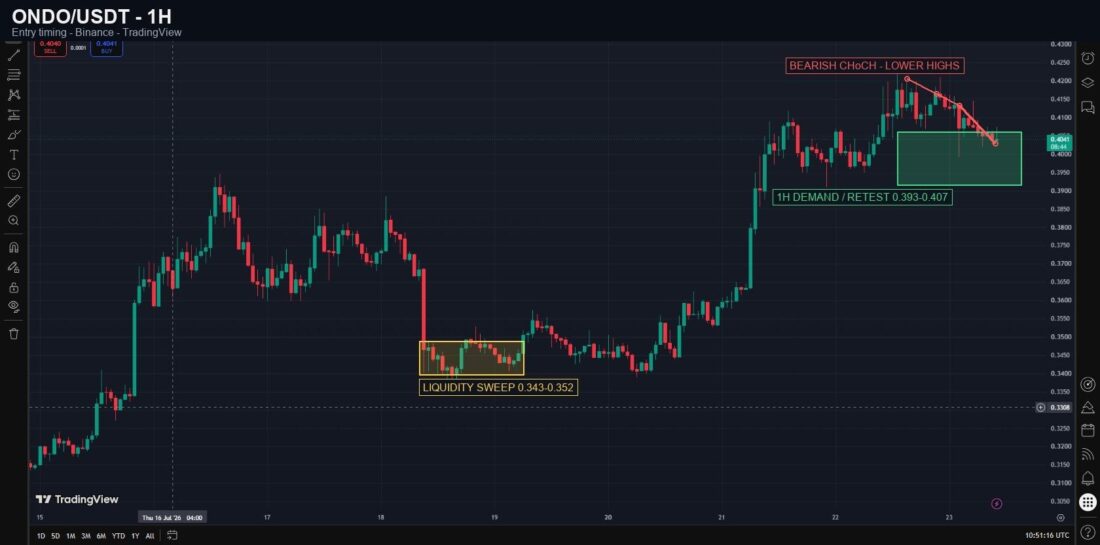
ONDO/USDT 1H chart. Source: TradingView / Binance.
Three timeframes, two different messages. The daily and four-hour charts both argue ONDO’s basing period is over and the trend has turned. The one-hour is arguing something else, at least for now, and which one wins probably gets decided in the $0.393 to $0.407 zone before the daily chart gets another vote.
None of this happens in a vacuum, either. Bitcoin’s own rally has drawn its own share of skepticism lately, with CryptoQuant data raising doubts about whether the move even holds, and alts tend to feel that kind of hesitation before it shows up in their own charts. Hold the retest zone, and $0.44 to $0.465 becomes the next fight. Lose it, and $0.345 is where the argument restarts.
This is chart analysis based on publicly available TradingView and Binance data, not financial advice. Crypto markets move fast and levels can invalidate within hours.
The post ONDO Flips Bullish on the Daily, But the Hourly Chart Just Turned Its Back appeared first on Live Bitcoin News.





