
Pepe (PEPE) is showing resilience in the mixed market conditions. The token is currently moving inside a cup and handle pattern, which often paves the way toward a strong bullish reversal. The PEPE price over the last 24 hours is showing stability, but over the last week it is slightly down by 6.86%.
At the time of writing, PEPE is trading at $0.00001061 with a 24-hour trading volume of $382.38 million, down by 17.59% over the last 24 hours. The token has a market capitalization of $4.46 billion, which is stable.
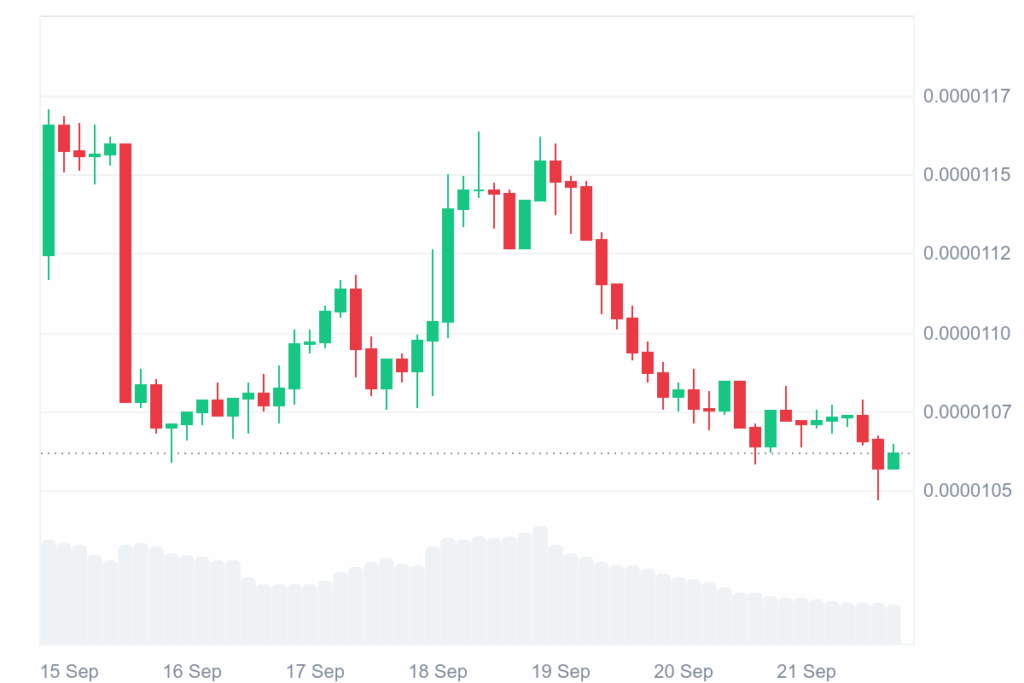
Source: CoinMarketCap
In general, the crypto market is showing mixed signals with a potential to turn upward. The big crypto coins like BTC and ETH are struggling, which has impacted the overall market, including altcoins like PEPE.
The crypto analyst, Hailey LUNC, revealed that PEPE is delivering a familiar message, and bulls and bears are running scared. It’s a typical cup-and-handle bottom formation at the lower end of its channel, the same formation behind previous parabolic moves. If history repeats, projections forecast a mind-bending 40X breakout from here.
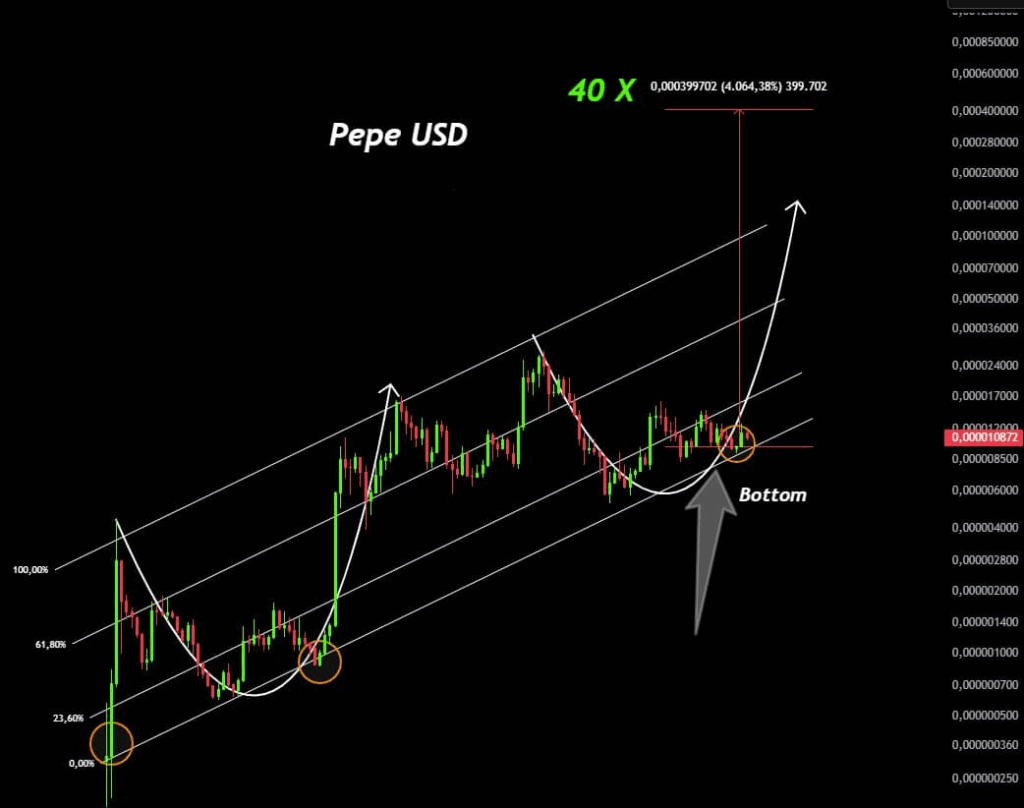
Source: X
The timing is hard to ignore, and meme coins are back in action while risk-on plays see liquidity come back. Charts never promise anything, but parallelisms between earlier PEPE breakout structures are watched closely by the community, hoping the frog is ready to jump again.
Also Read: PEPE Symmetrical Wedge Pattern Signals Rally Toward $0.00002583 Target
The weekly PEPE chart shows an elongated consolidation after strong rallies in early and late 2024. Right now, the price is fluctuating around the 50-week and 100-week moving averages, and the support is at around 0.00001 and resistance at 0.00002. Sideways action and attempts at holding higher lows are shown by the candles.
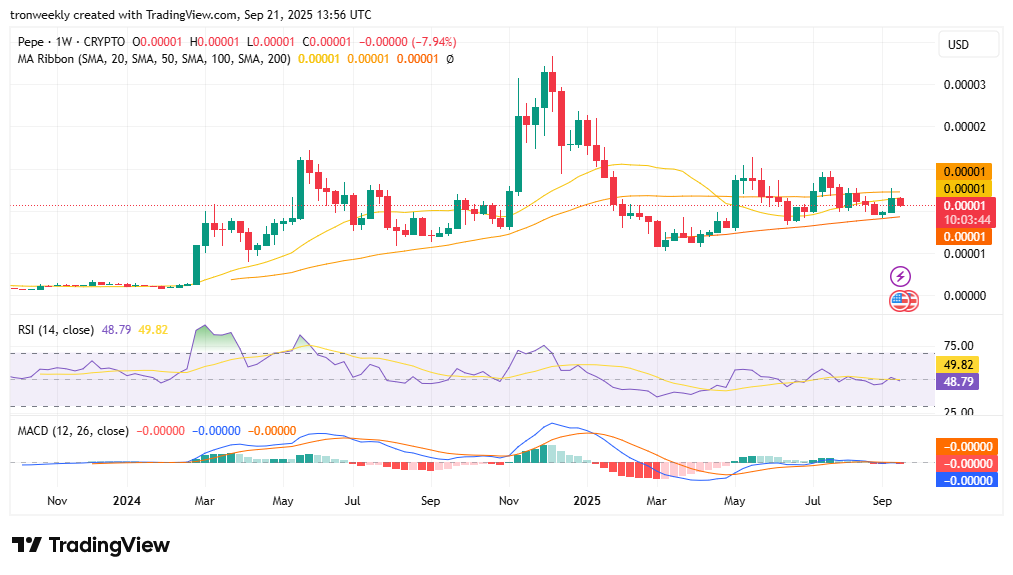
Source: TradingView
Momentum indicators show indecision, and RSI stays near neutral at ~49, which does not indicate overbought nor oversold conditions. The MACD is flat with weak signals on the histogram, a sign of low volatility and lack of clear trend direction, which is signaling a breakout sometime if momentum gains strength.
According to the data from CryptoRanks, during 2025, the chart shows highly volatile action with sudden intraday moves between losses and gains. It weakened at the beginning of the year, suffering back-to-back losses, mounted a brief recovery, but the overall profile registers volatility, in which little bouts of growth were negatively undone by new declines.
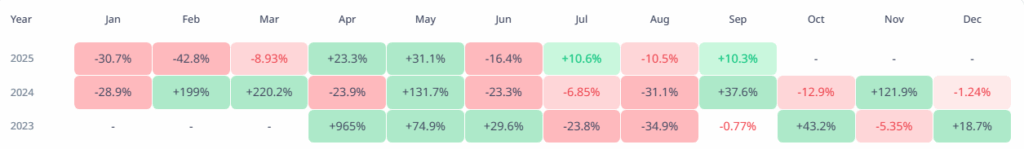
Source: CryptoRank
After the mid-year, July recorded growth of +10.6%, August pulled back to -10.5%, and September regained +10.3%. These figures reflect the reality of the back-and-forth progress of 2025, with growth unable to sustain itself beyond short periods.
Also Read: Pepe Coin Delivers Strong 24% Year-End Growth in 2025


