Pi Network (PI) is currently trading at $0.221, marking a 2.15% increase in the last 24 hours. This price movement aligns with a broader recovery in the digital asset market but is significantly amplified by the upcoming Pi Day on March 14. As the community anticipates major roadmap updates and ecosystem milestones, the token has managed to sustain its position above critical psychological support levels.

For traders asking if $Pi can break its current resistance, the short-term outlook remains cautiously bullish. The convergence of a major protocol upgrade on March 12 and the annual Pi Day celebration provides a strong fundamental backdrop for a potential move toward $0.24.
The Pi Network is a social cryptocurrency and developer platform that allows mobile users to mine PI tokens without draining battery life. Unlike traditional Proof-of-Work assets like $Bitcoin, Pi uses a consensus mechanism based on the Stellar Consensus Protocol (SCP).
Currently, the network is in its "Open Network" transition phase. The primary drivers for today's price action include:
The current rally is a classic "buy the rumor" scenario. Daily trading volumes have surged to approximately $39 million, indicating a sharp increase in retail participation.
The Core Team has moved the deadline for the v20.2 protocol upgrade to March 12. This upgrade is essential for the network's stability and is rumored to be a precursor for the launch of Pi Decentralized Exchange (DEX) tools. Successful implementation is expected to reduce network latency and prepare the infrastructure for higher transaction throughput.
According to data from Santiment, social volume for Pi Network has spiked in the first week of March. While increased "social whispering" often precedes a local top, the proximity to a scheduled event (Pi Day) suggests that the speculative premium may hold until the actual announcements are made.
From a technical perspective, PI is showing signs of a bullish pennant formation on the daily chart.
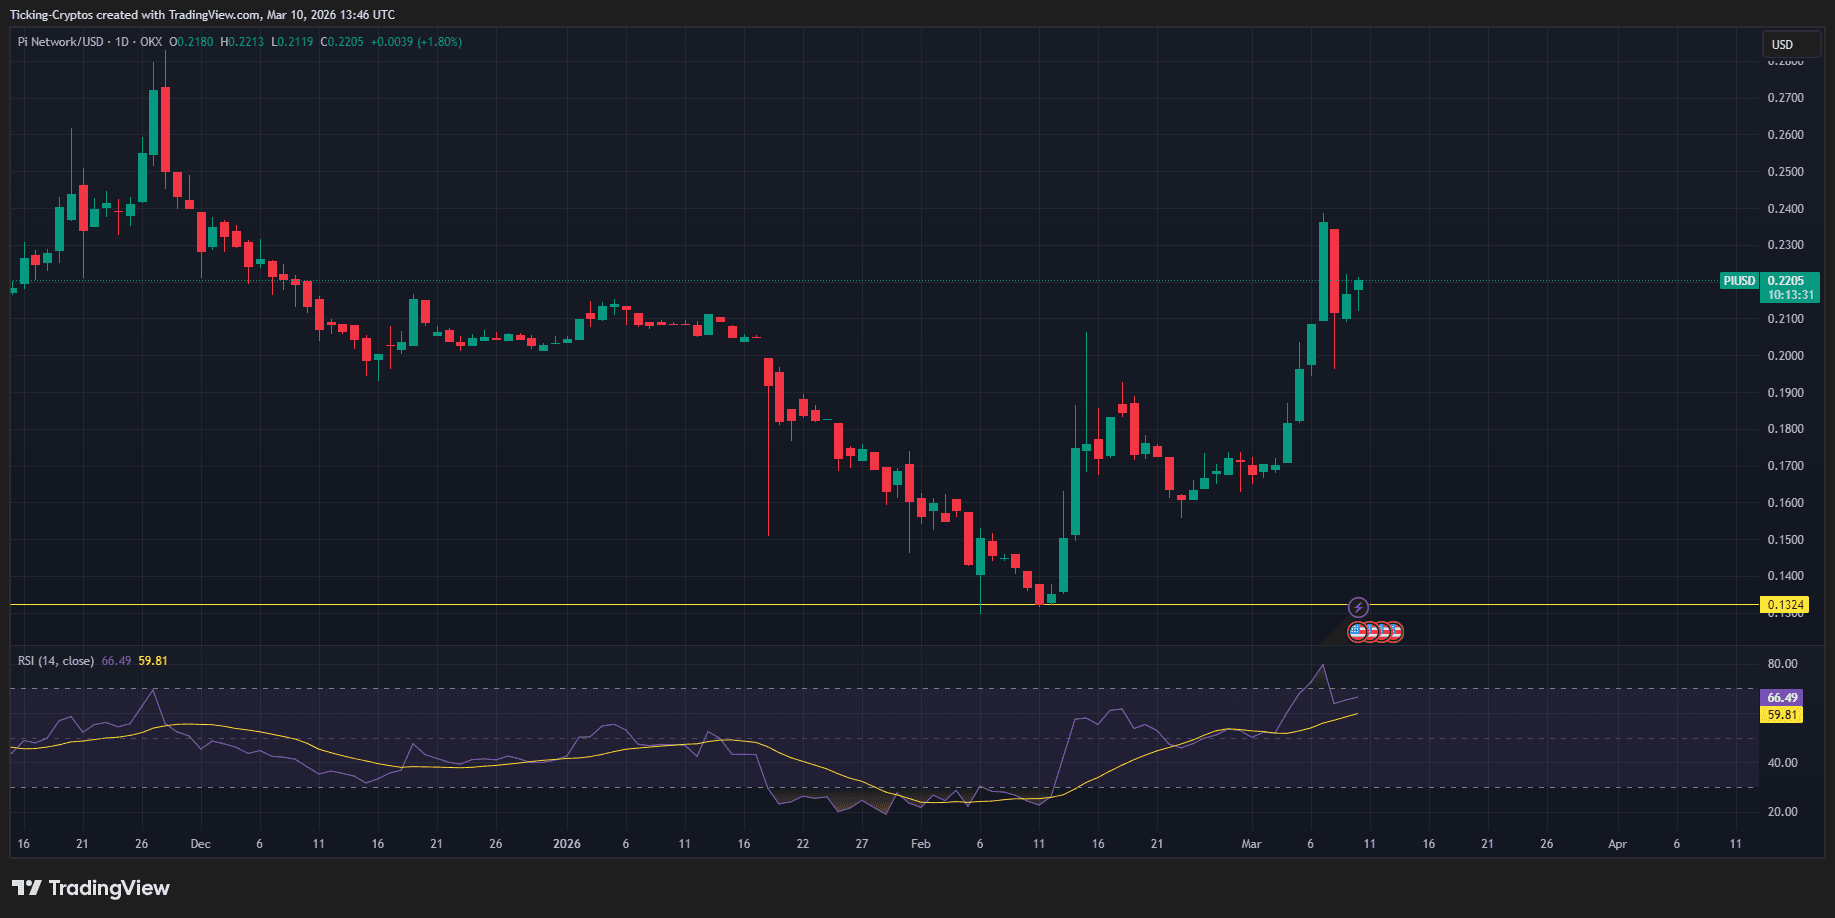
If PI holds above the $0.20 support, the probability of a retest of the $0.24 level before March 14 remains high. However, an RSI reading near 70 suggests the asset is approaching overbought territory, increasing the risk of a "sell the news" correction post-event.
| Level Type | Price Range | Technical Significance |
|---|---|---|
| Immediate Resistance | $0.237 – $0.240 | Previous local high and supply zone. |
| Major Resistance | $0.285 | 200-day Exponential Moving Average (EMA). |
| Key Support | $0.200 – $0.204 | 100-day EMA and psychological floor. |
| Secondary Support | $0.186 | Historical demand zone. |


