
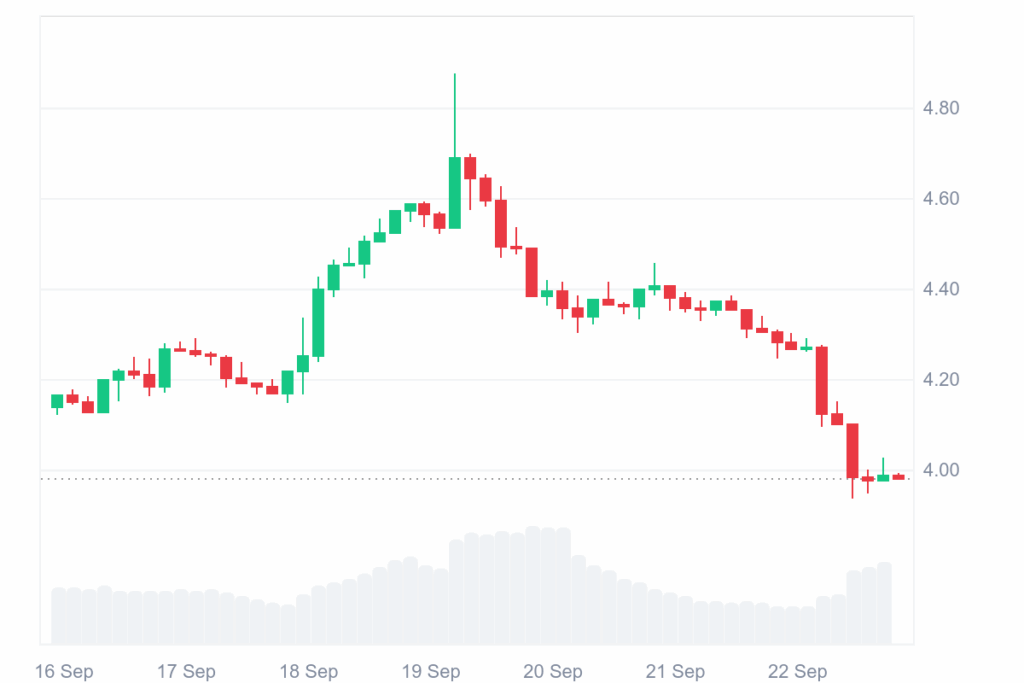
DOT is experiencing a downward pressure but showing resilience despite the bearish market conditions. Currently DOT is moving inside a falling wedge pattern, which often paves the way to a bullish reversal. The DOT price over the last 24 hours is down by 6.97%, and over the last week it is also down by 3.89%.
At the time of writing, DOT is trading at $3.98 with a 24-hour trading volume of $491.02 million, up significantly by 114.69% over the last 24 hours. The token has a market capitalization of $6.44 billion, which is down by 7.06%.
Source: CoinMarketCap
In general, the crypto market trend has turned bearish as major crypto coins like BTC and ETH have started downward momentum. This decreasing interest has badly affected the overall market, including altcoins like DOT.
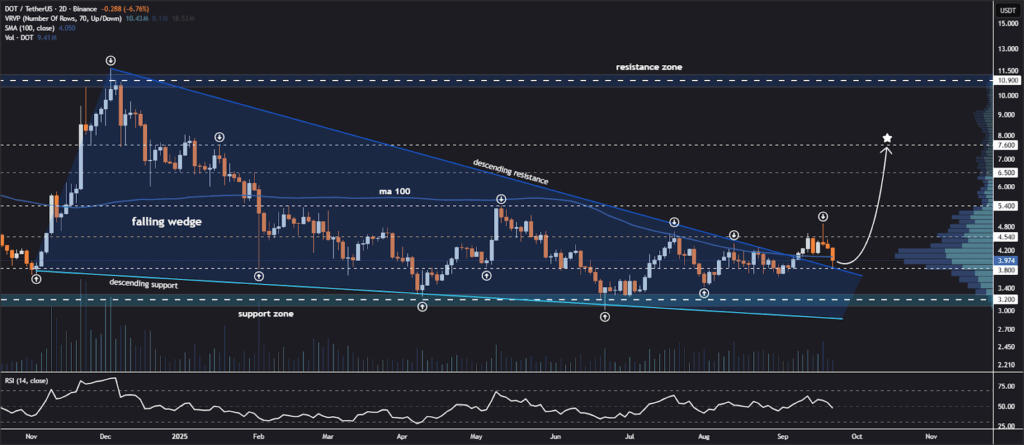
Moreover, the crypto analyst, Jonathan Carter, highlighted that Polkadot (DOT) is currently retesting its breakout from a prolonged falling wedge formation on the 2-day chart, a technical setup often linked to bullish reversals.
The token is now validating the previously broken wedge resistance as a fresh support level, a move that could prove decisive for its short-term momentum and overall market positioning.
Source: X
If buyers manage to firmly defend this zone, DOT may gather strength for a rally toward $4.54 and $5.40, with stronger bullish continuation potentially targeting $6.50 and $7.60. A confirmed support hold would signal renewed investor confidence in Polkadot, making it one of the altcoins to closely watch as broader market sentiment gradually steadies.
Also Read: Polkadot Whales Accumulate $133 Million DOT as Price Targets $10 Breakout
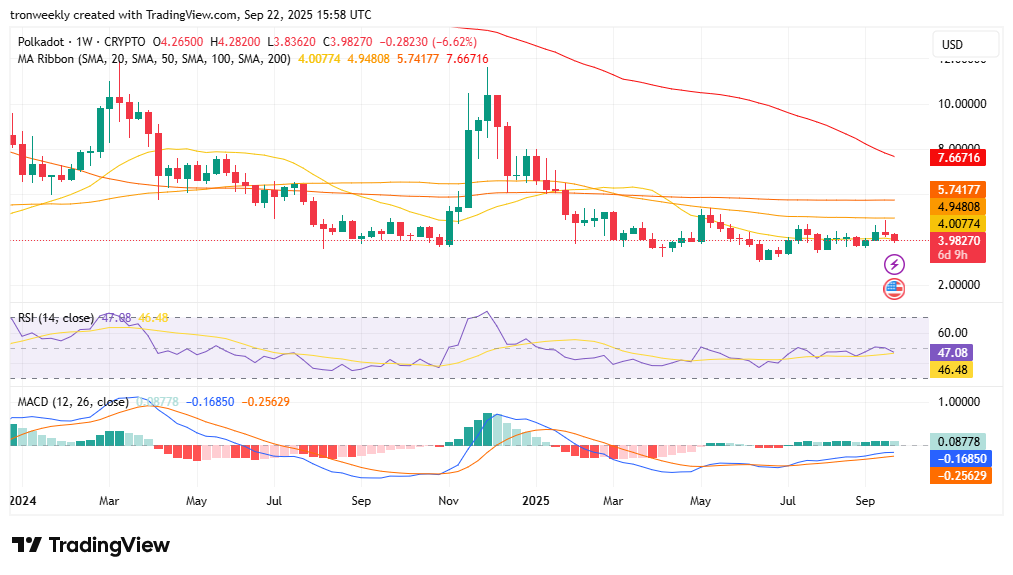
The Polkadot weekly chart shows a bearish action as candles closed below key moving averages. The MA ribbon also indicates strong resistance above, as the price resides below multiple important averages. This suggests the larger trend continues to be weighed down by down pressure, although there have been short tries at bouncing back.
Source: TradingView
Momentum indicators remain neutral to bearish. The RSI at 47.08, just below the neutral 50 line, shows neither active purchases nor sales pressure. The MACD line (-0.1685) is just above the signal line (-0.2563) with a minor positive histogram, indicating a probable, but not quite strong, bullish crossover.
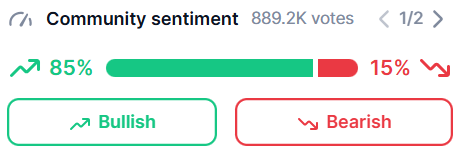
According to the data from CMC, the latest sentiment poll of the community, reaching near 889.2K votes, shows an overwhelming bull sentiment dominance in the market. Roughly 85% of participants are casting their votes in support of bulls, showing optimism in future positive developments.
Source: CMC
On the other hand, there still remain just 15% bearish voters predicting an imminent downside move. This overwhelming majority of voters signifies increased optimism and gaining faith among investors.
Also Read: Polkadot (DOT) Eyes $25 as Falling Wedge Signals Breakout Potential


