
Polkadot (DOT) shows mixed momentum, declining 1.03% in the past 24 hours. As of March 27, 2026, it signals short-term pressure while recording a 15.03% weekly drop despite improving market conditions and rising participation.
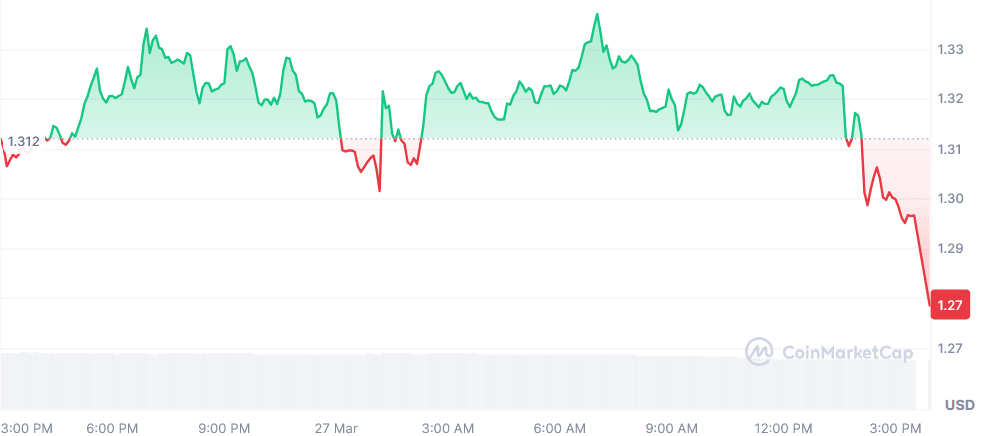
According to CoinMarketCap data, the token is trading at $1.29, supported by rising market activity. The 24-hour trading volume stands at $186.95 million, reflecting a 13.55% daily decline. Meanwhile, market capitalization is at $2.17 billion, down 1.14% over the same period.
Also Read: Polkadot (DOT) Targets $3.80 After SEC Regulatory Clarity Boost
The 12-hour DOT chart shows a prolonged bearish trend that began in late 2025, with consistent lower highs and lower lows confirming strong selling pressure.
The structure appears to follow an Elliott Wave decline, with wave (5) completing near the $1.10–$1.00 region, marking a potential macro bottom.
A corrective ABC pattern has now formed after the dip, as prices pressed into wave A and found a local high at $1.60-$1.70.
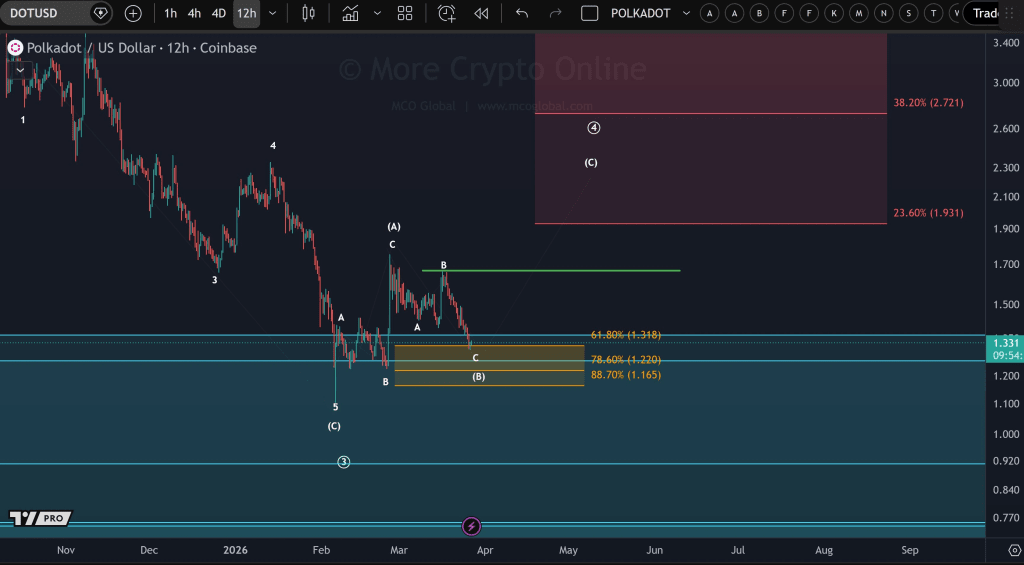
The B wave was just a correction, and now prices are trading in an important Fib retracement zone between 0.618 ($1.31) and 0.887 ($1.16).
Therefore, if this support zone is maintained, a bullish wave C can occur, which can target the $1.90-$2.70 zone based on the 23.6% and 38.2% Fibonacci retracements.
However, if the price falls below $1.16, this bullish view can be negated, and DOT can fall further towards the $0.90 mark, according to the Crypto analyst More Crypto Online.
Currently, technical indicators remain in favor of a short-term bearish trend. The Relative Strength Index stands at 35.68, with the moving average still stuck at a position around 46.71.
This decline suggests a decrease in buying pressure as the RSI approaches the oversold region below 30.
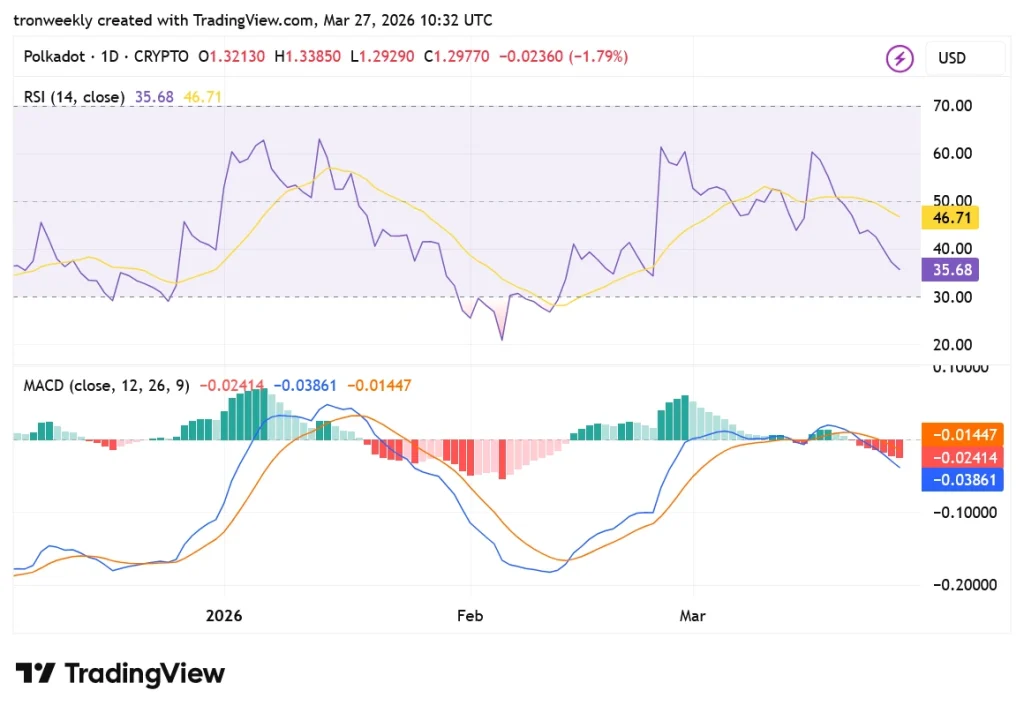
The MACD indicator confirms this view. The MACD line remains below the signal line, and the histogram remains in the negative zone.
This combination is a sign of ongoing selling pressure. The widening distance below the zero line indicates increasing selling pressure, meaning sellers are still in control.
Polkadot is currently trading in the $1.16-$1.31 range, which is an important area for it. A fall below this area could accelerate its decline further.
A bounce from this area is also possible. The RSI and MACD indicators for Polkadot are bearish, but momentum appears to be dying out.
This article contains market analysis and price predictions. These are not guarantees. Crypto markets are volatile. Always DYOR. Not financial advice.
Also Read: Polkadot (DOT) Falls Below Key Support: Is a Drop to $1.20 Next?

