
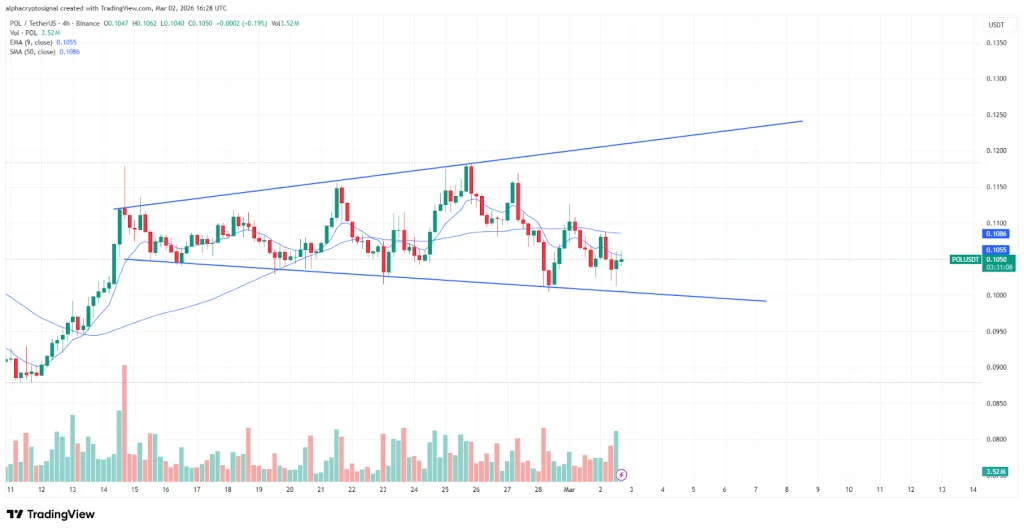
Polygon (POL) is trading within a broadening wedge pattern on the 4-hour chart, marked by expanding highs and lows that reflect rising volatility.
According to the crypto analyst Alpha Crypto Signal, the structure remains technically intact after the price rejected from the upper trendline and rotated lower, signaling continued range expansion rather than a confirmed directional breakout at this stage.
Source: Alpha Crypto Signal X Post
The token is now positioned near the lower boundary of the wedge, a key dynamic support zone that will likely determine short-term direction.
As long as this level holds, the broader formation suggests potential for another upside swing toward the upper boundary, with resistance projected near the $0.125 region ahead.
Also Read: Polkadot (DOT) Support Retest Could Lead to a Bullish Rally Above $1.70
Widening wedges indicate a rise in market indecision as buyers and sellers push prices to wider and wider boundaries without being able to gain the upper hand.
This behavior often leads to wild swings within the range or abrupt changes of direction. For POL, believing in the strength of both trendlines would reinforce the idea of increasing volatility rather than a breakdown.
A decisive break below the lower wedge support would invalidate the notion of an expanding range and shift the short-term momentum towards the bears.
This would propel the downside pressure more rapidly as the range traders close positions. Until then, it is imperative for traders to be bracing for the choppiness that would continue with increasingly expanding price levels.
The RSI (14) currently stands at 42.57, which has fallen below its yellow signal line positioned at 49.45. As this is placed within the lower half of the middle zone, this may indicate low buying activity. As the line continues to dip, the momentum is losing steam and moving towards the oversold zone.
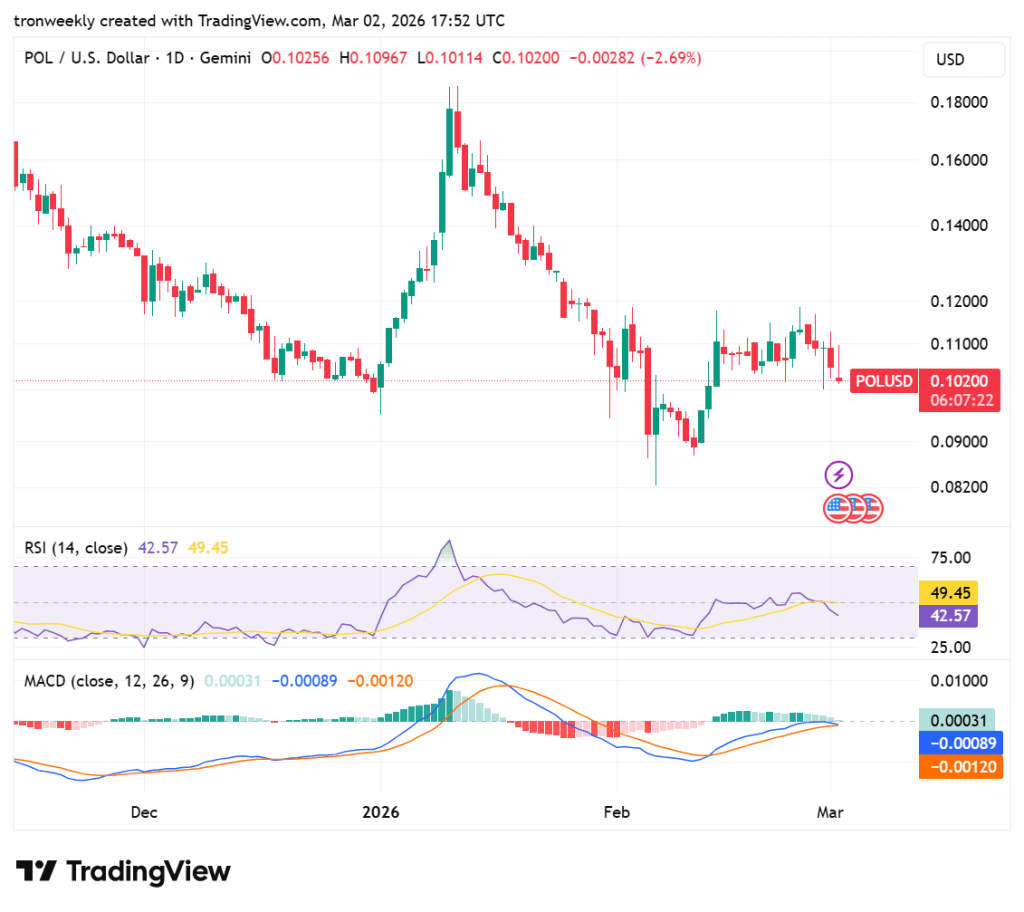
Source: TradingView
The MACD indicator also shows the bullish push diminishing, with the blue line sitting just above the orange line at 0.00031. However, the size of the histogram bars is diminishing rapidly, suggesting that a bearish crossover could be imminent.
This also suggests that the previous uptrend is losing momentum, keeping the market on the verge of a change in control.
Also Read: Polkadot (DOT) Near Critical Low: Bulls Eye $3.00–$6.00 if Momentum Returns

