
Polygon price analysis signals a breakout after the POL price rebounded from falling wedge support. The move highlights a key technical reaction identified by analyst Profit Demon on the 2-day timeframe.
Data from CoinMarketCap shows POL trading near $0.0936 at the time of writing. The rebound suggests renewed buying interest after extended downside pressure, increasing the likelihood of a short-term bullish reversal.
Reversal structures, such as a falling wedge or “compression,” are often associated with a significant amount of upward momentum after the breakout.
Profit Demon’s chart illustrates that the Polygon cryptocurrency respected the lower edge of a falling wedge formation. Breaking through the resistance can be considered a sign of a potential bull run.
Additionally, there is increasing momentum as the price is forming higher lows inside the wedge. The Polygon cryptocurrency has stabilized above an important trendline of support.
If the falling wedge pattern continues to hold true, then it seems like a more certain breakout scenario would develop.

Also Read | Polygon (POL) Relief Rally Could Drive the Price Higher Toward $0.19
Multiple levels of support for the upside gains exist, according to the Polygon price analysis. These include projected levels of $0.12, $0.17, $0.21, $0.29, and $0.41.
The levels mentioned earlier are both historically relevant resistance areas and Fibonacci extension levels. To achieve these levels, ongoing purchasing power and increasing volumes are required.
Immediate support exists in the area of $0.090-$0.092. If the Polygon cryptocurrency falls below this zone, it may create some temporary delays in the development of the bullish setup.
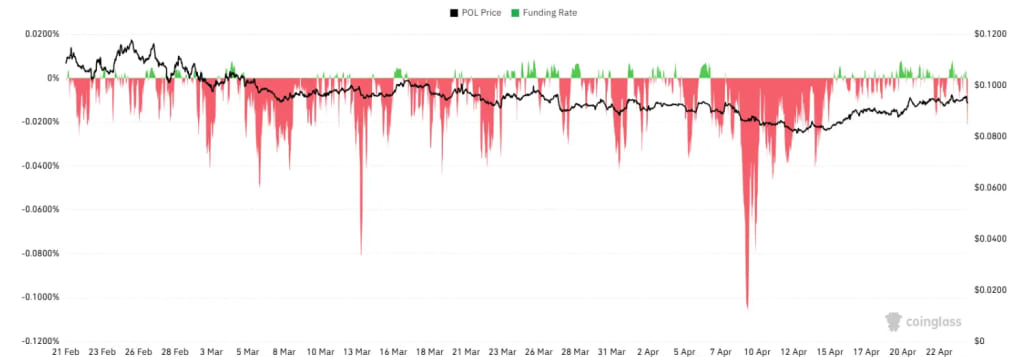
CoinGlass data indicate that lessening leverage risk currently exists as regards the POL derivative market. Activity decreased in POL derivatives by 19.26% to around $62.28 million.
Open interest slightly fell as well, which indicates that traders have positioned themselves less aggressively, utilizing leveraged instruments. As a result of these factors, the POL price may respond differently to changes in the market environment.
Negative funding rates reflect cautious sentiment among traders. They can help support upside movement during short squeezes.
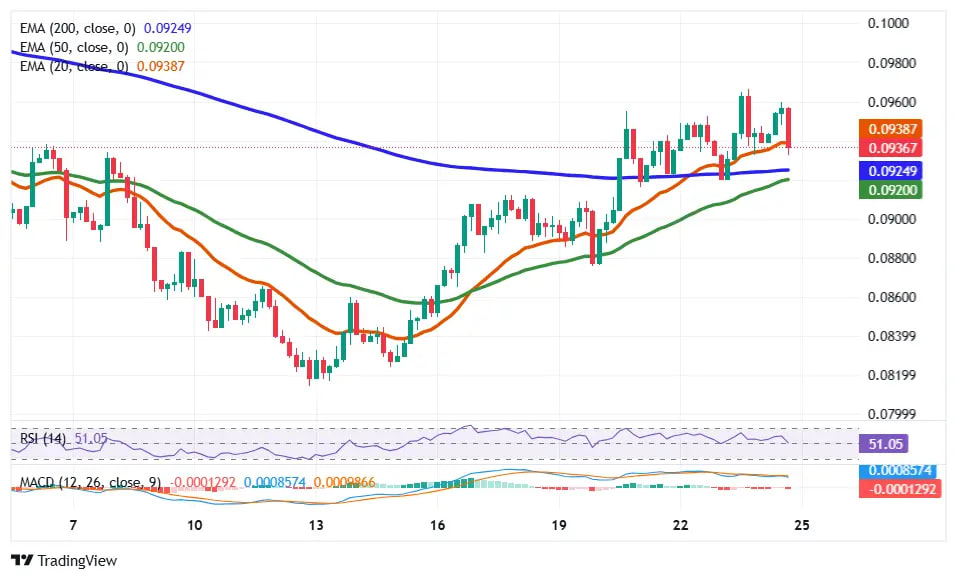
The TradingView technical indicators illustrate that the trend is shifting in favor of the bulls. Short-term bullishness is signaled by the 20 EMA being above the 50 EMA.
Although the 200 EMA serves as overhead resistance for the Polygon cryptocurrency, it is moving closer to supporting the bullish position. Neutral conditions exist since RSI reads close to 51, and there appears to be more room for expansion.
Mild bullish divergence is evident based on MACD readings, which suggest that overall momentum is slowly beginning to improve. Collectively, these indicators confirm a possible breakout scenario.
Lower timeframe charts demonstrate that POL is consolidating in a small range. Recently, a dip in the POL price was immediately followed by purchases from sellers, illustrating a high demand at support zones.
When investors buy at or very near support levels, it occurs before a much larger directional move takes place. Buyers maintaining control of the price direction will most contribute to the expanding volatility surrounding the Polygon cryptocurrency price.
Polygon provides an essential layer-2 solution for the Ethereum ecosystem. Its performance may serve as an indicator of overall sentiment towards altcoins.
A combination of favorable technical characteristics and decreasing leverage risk increases the likelihood of a directional breakout move. Confirmation of a directional breakout move depends on whether or not Polygon clears the wedge resistance.
Traders will continue to observe both volume and momentum for verification signals. Risk exists if broad market conditions deteriorate. Participants must closely monitor key levels and use caution in managing their exposures.
This article contains market analysis and price predictions. These are not guarantees. Crypto markets are volatile. Always DYOR. Not financial advice.
Also Read | Polygon (POL) Falling Wedge Breakout Could Trigger Strong Rally to $0.41

