
The Quasimodo pattern is a reversal structure that closely resembles the Head and Shoulders. Many traders overlook it or mistake it for its more popular counterpart in price action trading. The QM pattern has distinct entry, stop-loss, and take-profit rules that set it apart. This article covers its structure, the methods used to confirm signals, and the execution rules.
The Quasimodo pattern is a reversal chart structure that forms at the end of a trend. The QM pattern relies on a failed continuation. Price prints a higher high (or lower low) in line with the trend. Then it reverses and breaks the prior swing in the opposite direction. This break invalidates the previous structure and signals exhaustion. QM pattern trading suits any timeframe. A Quasimodo trading strategy may be used across forex, stock, and commodity charts.
The pattern has two variants:
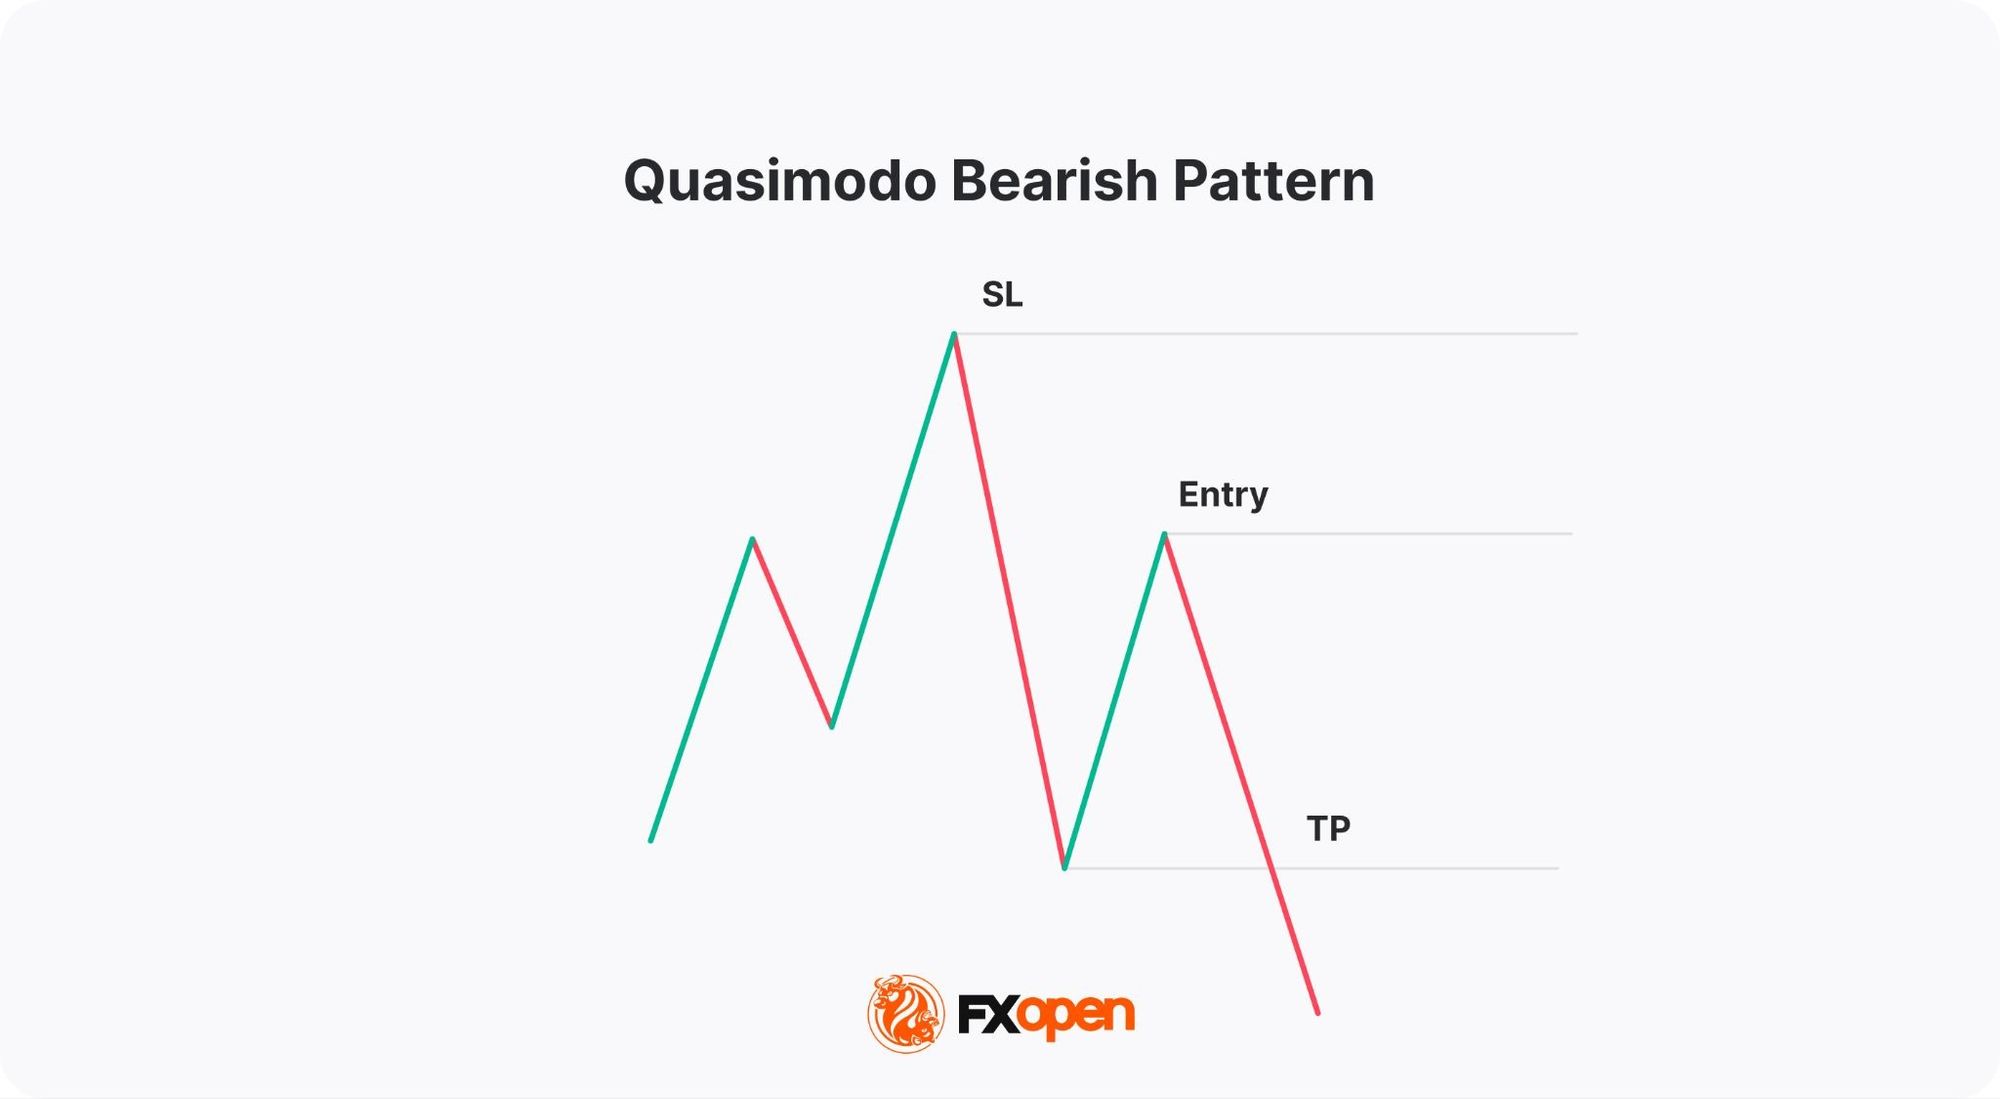
A bearish QM occurs at the end of an uptrend and signals the formation of a new downtrend. It consists of three peaks (a head in the middle and two shoulders at the sides) and two troughs. The second peak (head) is the highest, and the second trough is the lowest.
A bearish QM reversal pattern forms in six moves:
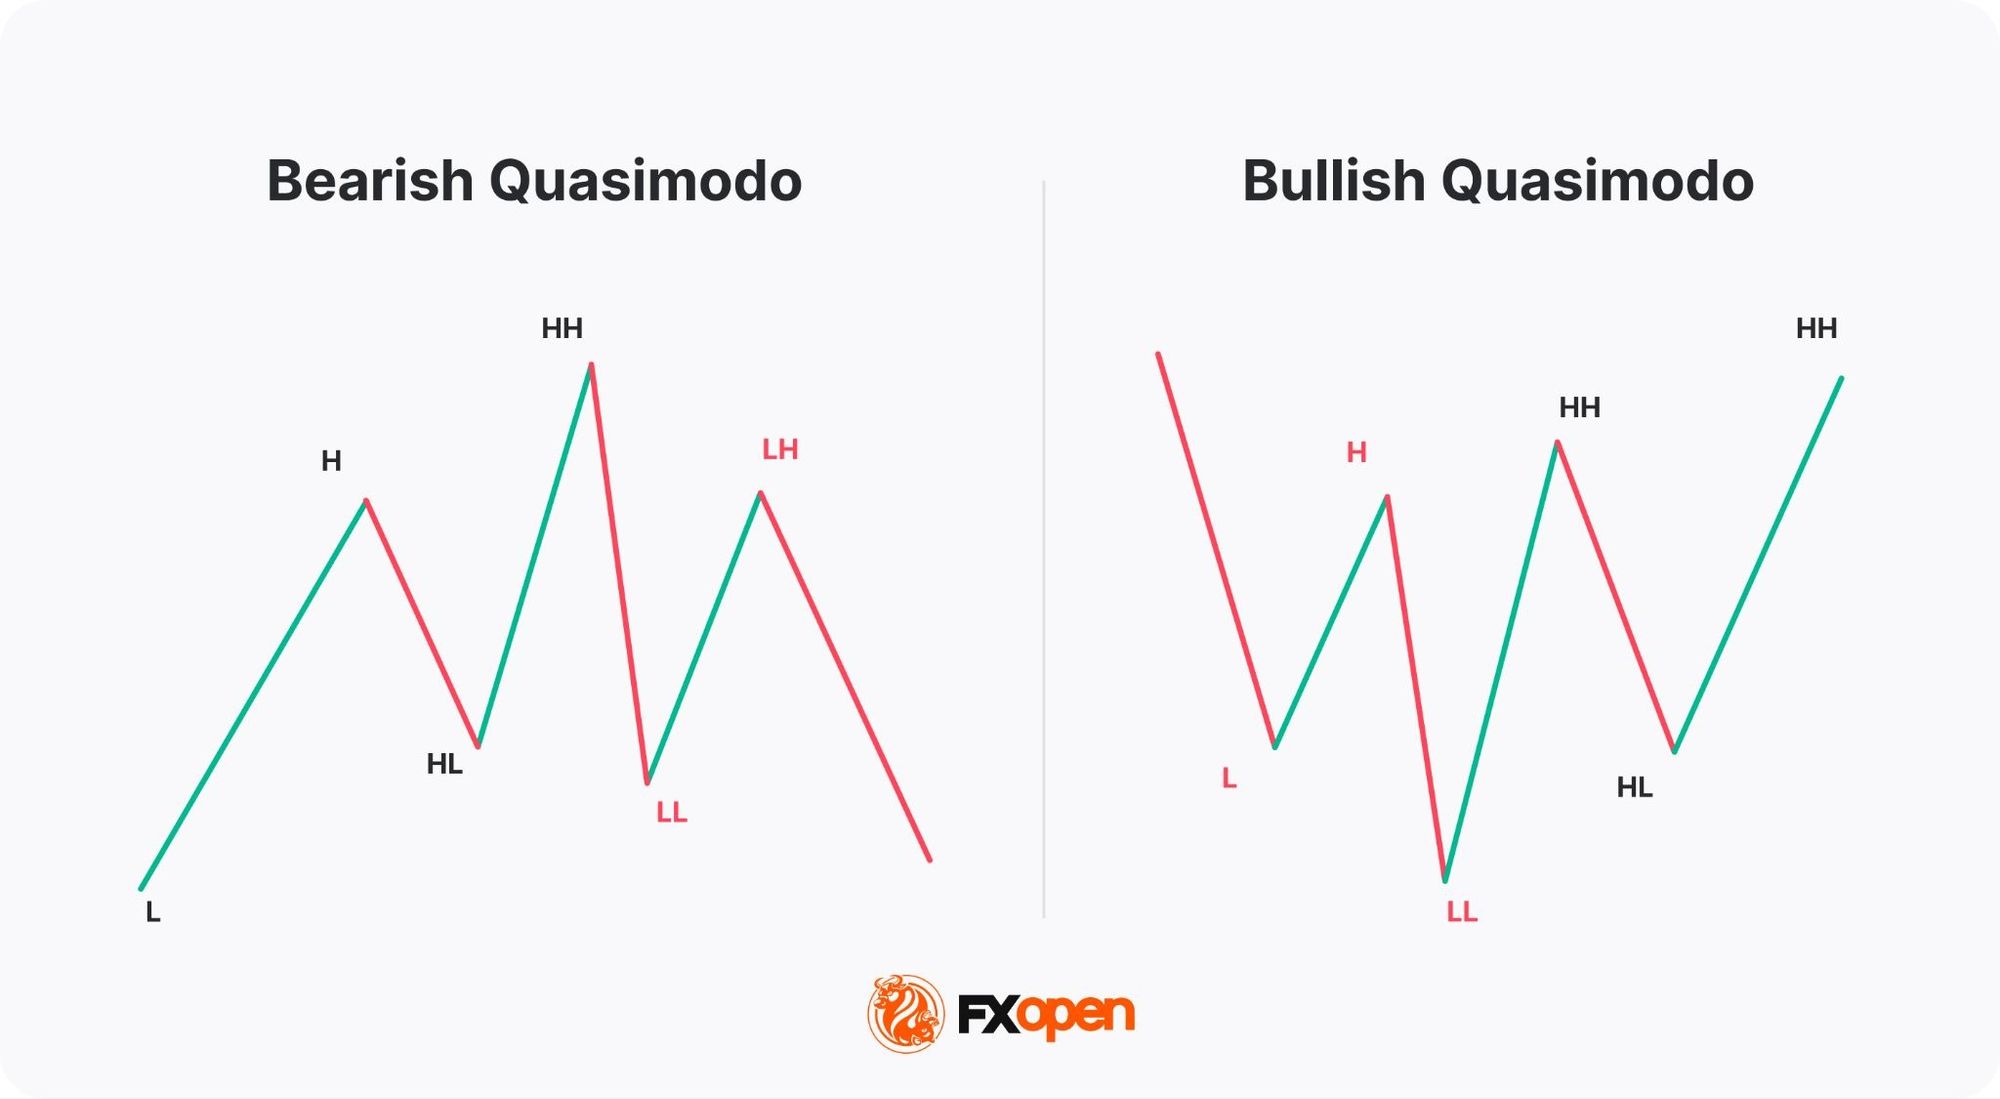
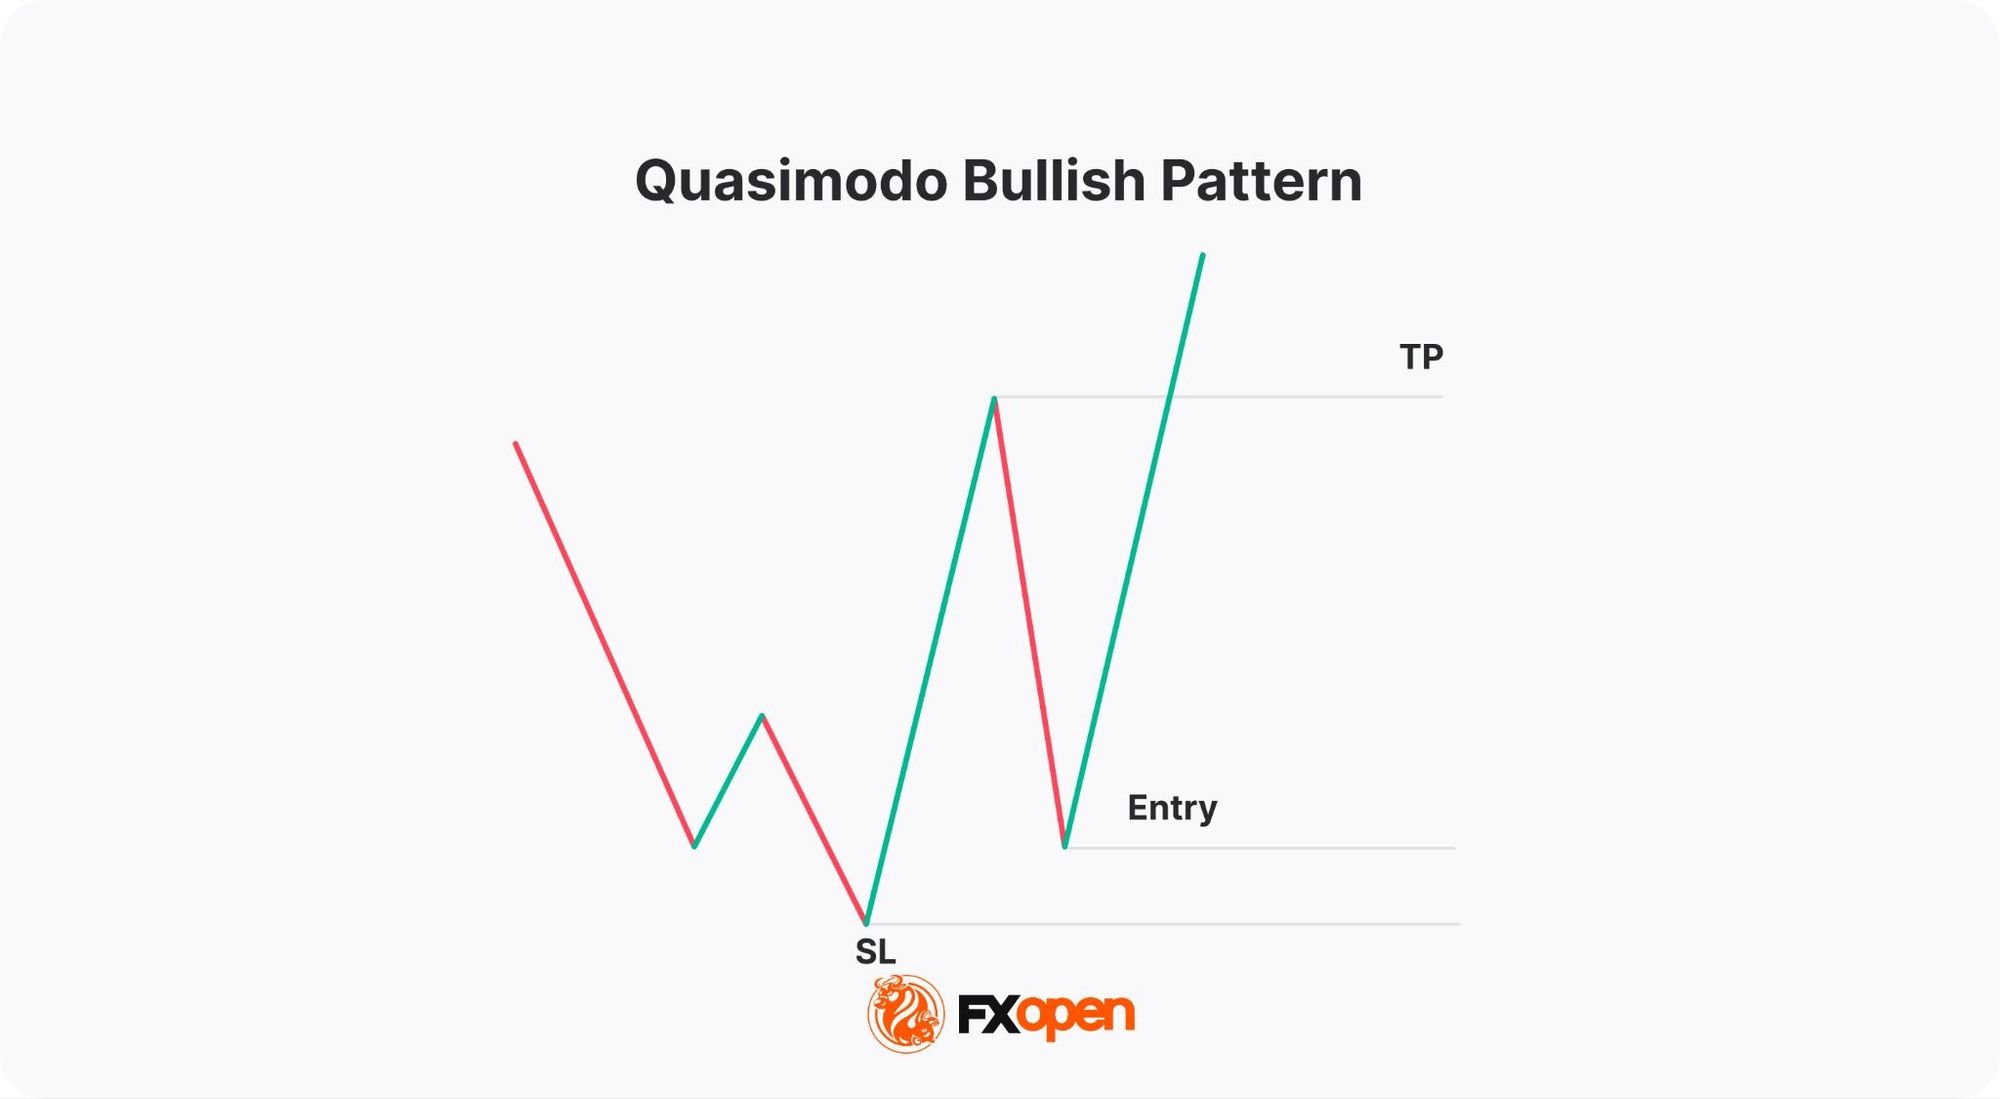
A bullish (inverse) Quasimodo occurs at the end of a downtrend and signals a potential uptrend. It consists of three lows (a head in the middle and two shoulders at the sides) and two tops, where the second trough (head) is the lowest and the second top is the highest.
A bullish QM forms in six moves:
The QM pattern reflects a specific shift in market structure. Price extends the prevailing trend by sweeping the prior swing high or low. This sweep often triggers stops and absorbs liquidity sitting above old highs or below old lows.
Buyers (or sellers) fail to push price further. The market then reverses and breaks the opposite swing, invalidating the trend's structure. This failed continuation is what gives the QM its reversal signal.
In terms of reliability, the Quasimodo pattern is considered useful for identifying trend reversals, particularly when supported by other technical indicators like the RSI or MACD. Unlike more common patterns, the QM pattern provides distinct entry and exit points.
Its reliability might increase in strongly trending markets, where the previous trend is well-defined, and the pattern clearly indicates a reversal. CME Group's reference on reversal chart patterns notes that confirmation through volume or follow-through movement strengthens any reversal signal.
The Quasimodo trading strategy defines four execution components tied to pattern structure:
Risk-to-reward depends on shoulder placement. A right shoulder formed close to the second trough (or peak) shortens the take-profit distance and may produce a 1:1 ratio or worse. A shoulder formed further away can deliver 1:2 or 1:3. In a QM entry strategy, traders often filter setups by the structural geometry rather than entering every formation.
The table below summarises the QM pattern entry and stop loss logic for both directions:
Parameter | Bearish QM (sell) | Bullish QM (buy) |
Trigger | Right shoulder forms below the head after price prints a lower low | Right shoulder forms above the head after price prints a higher high |
Entry | At the right shoulder, on reversal confirmation | At the right shoulder, on reversal confirmation |
Stop loss | Just above the head (highest peak) | Just below the head (lowest trough) |
Take profit | At the second trough (lowest prior swing) | At the second peak (highest prior swing) |
Invalidation | Price closes above the head | Price closes below the head |
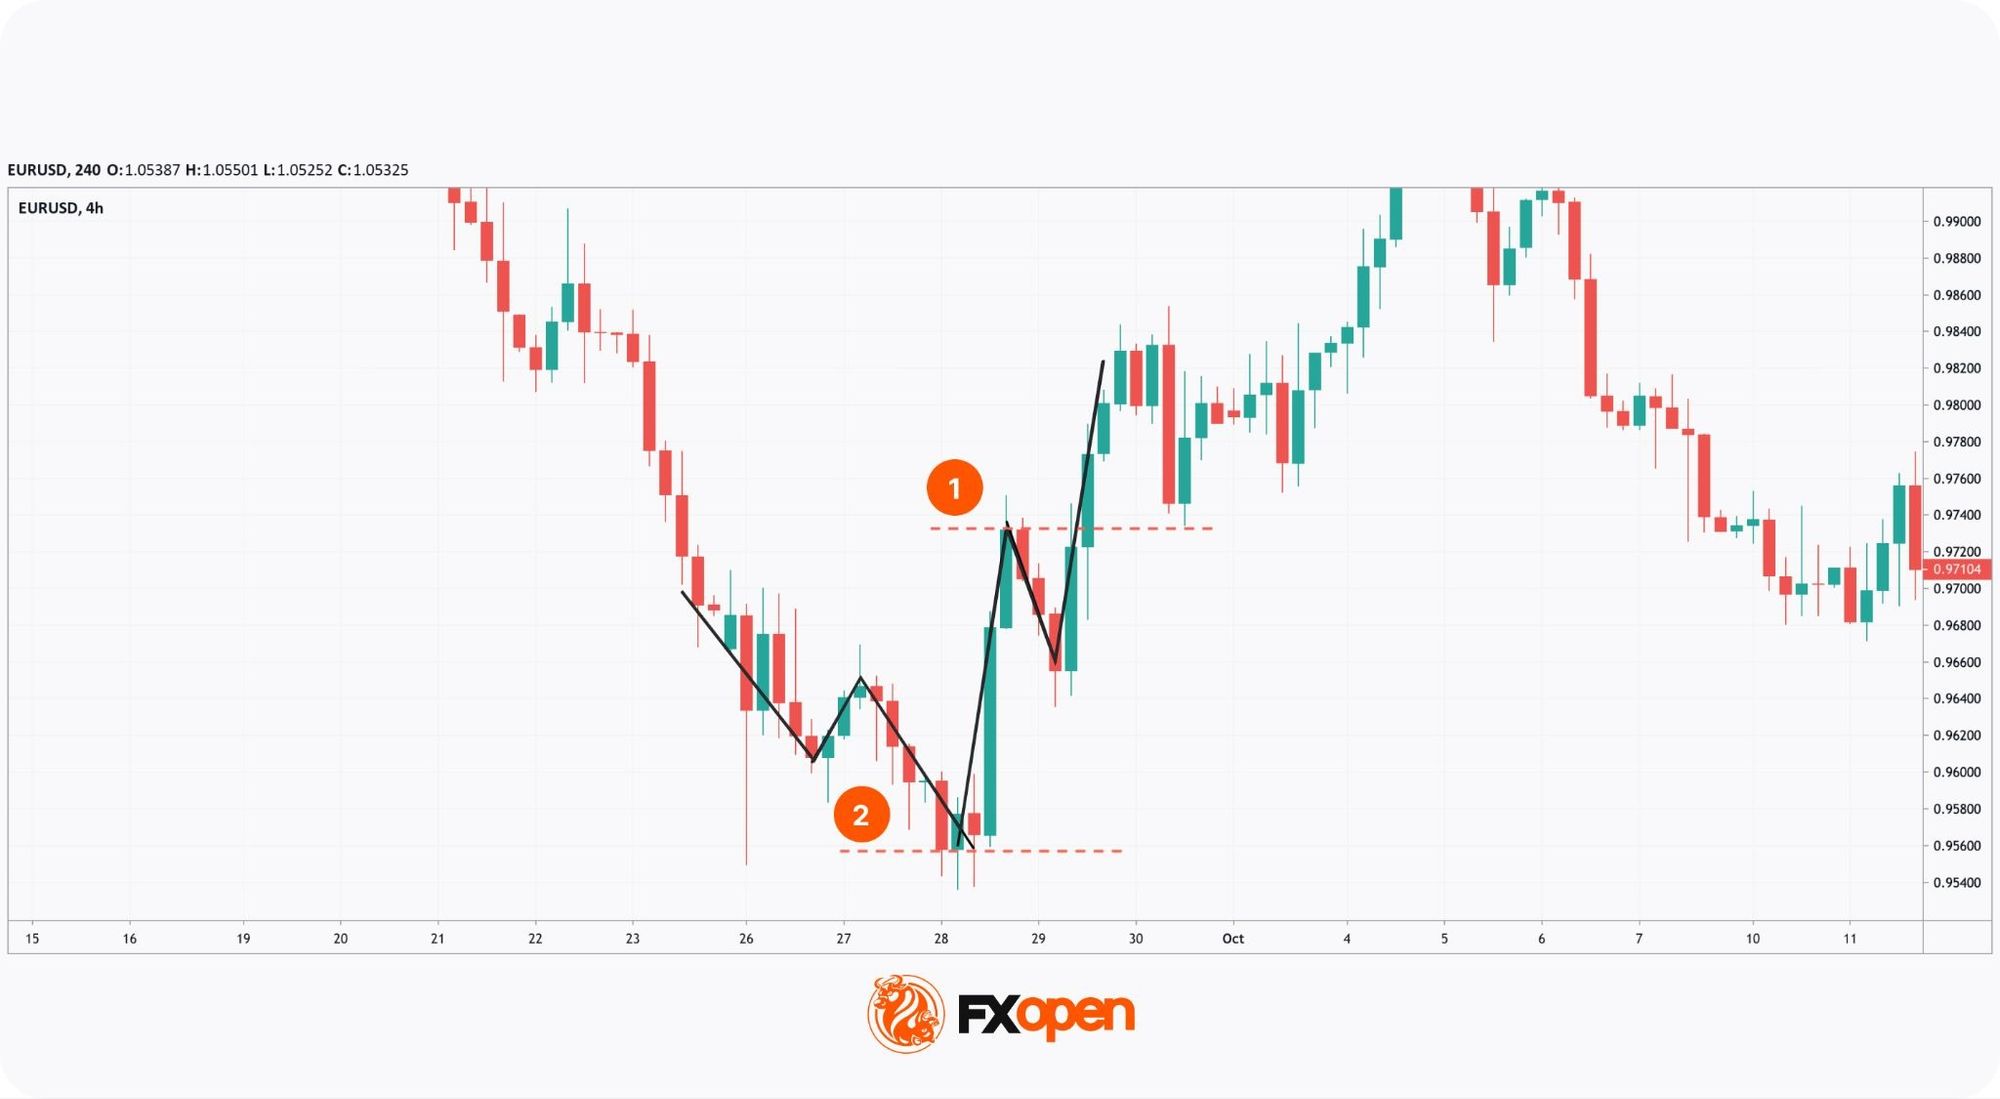
Any theory is always based on perfect conditions, but the actual market often differs. For example, on the chart below, the take-profit target (1) is three times smaller than the stop-loss level (2). In such cases, standard rules don't work.
In this particular case, we would avoid trading as the risk/reward ratio is negative and potential loss is twice potential profit.
Distorted Quasimodo forex structures often appear in three forms:
A setup is often avoided when:
The QM and the Head and Shoulders are reversal patterns. They look similar but still differ and provide different entry/exit points. Take a look at the image below.
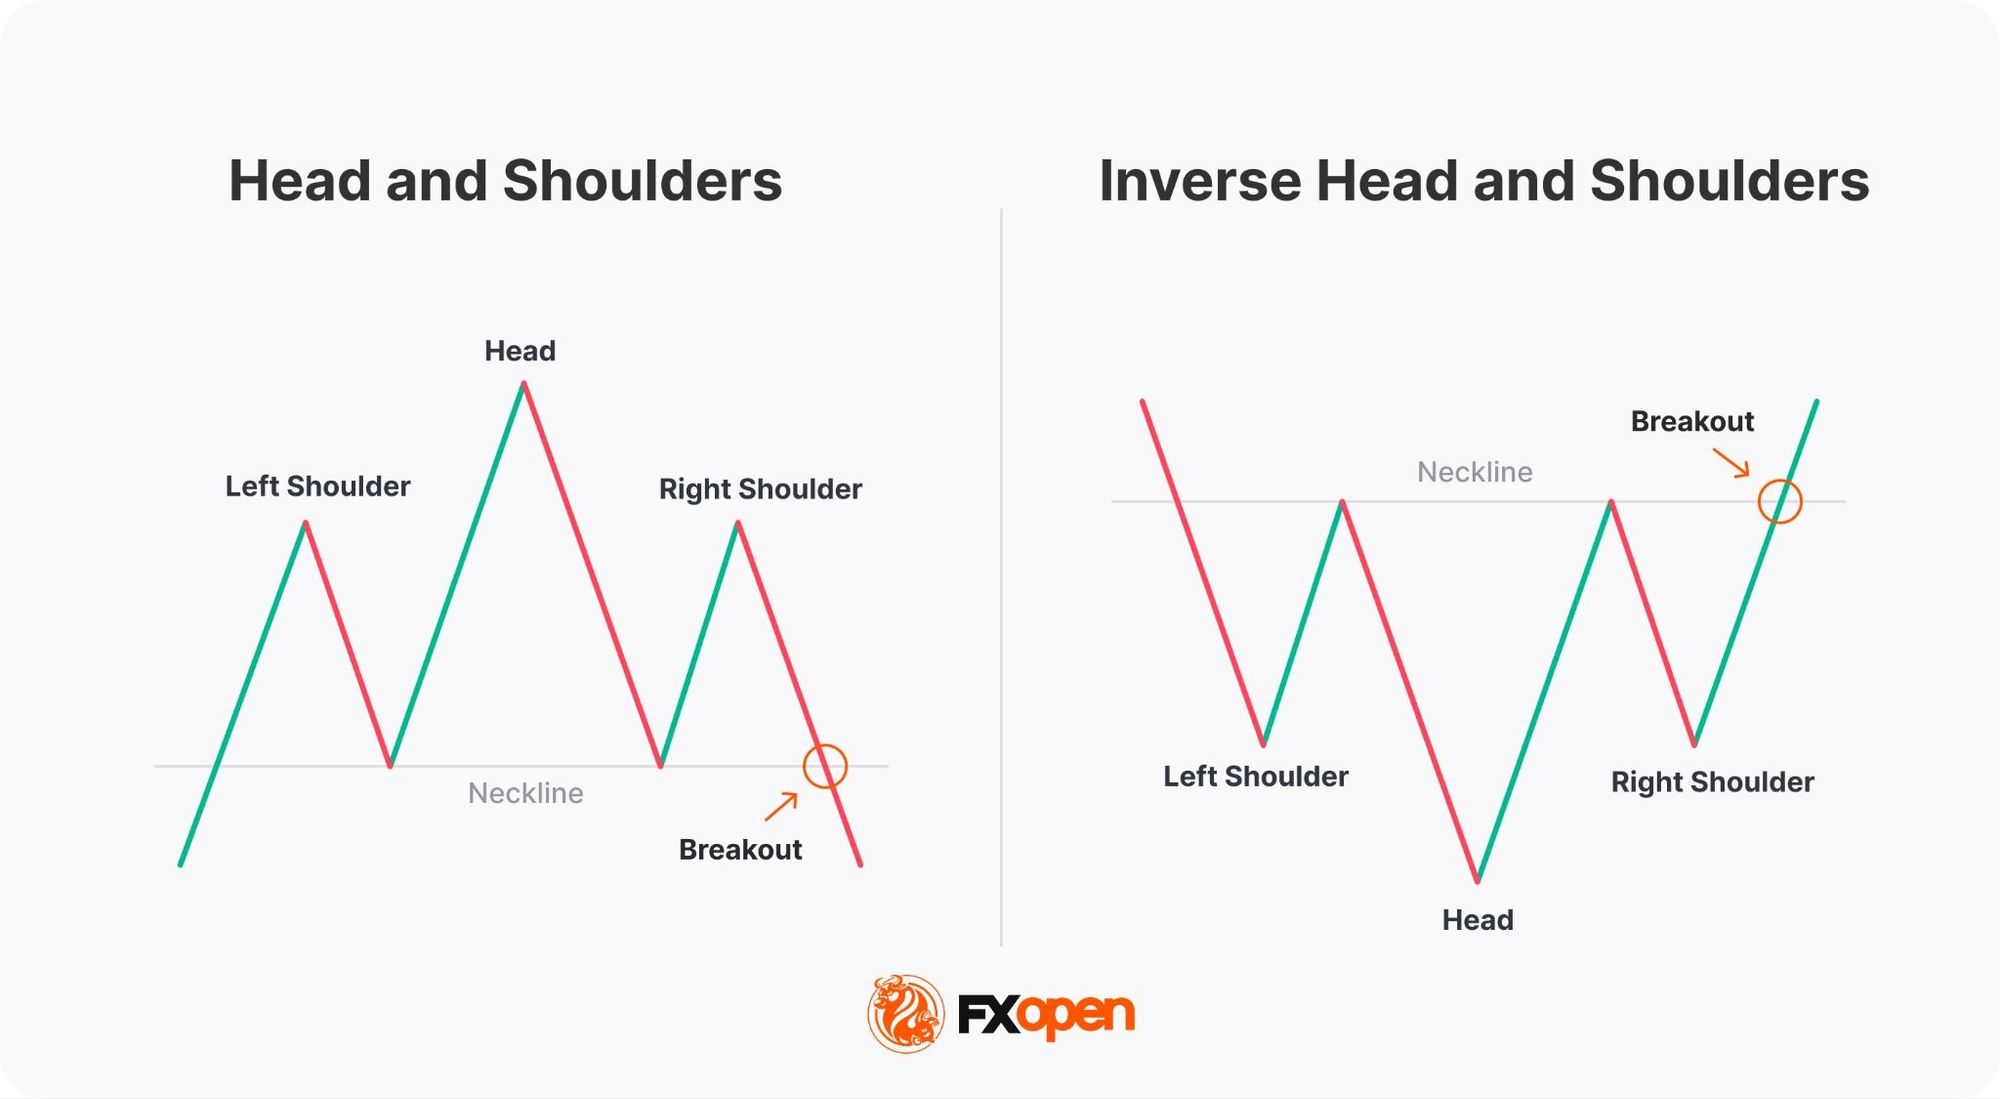
The bearish Head and Shoulders also has three maximums and two minimums, where the second peak (head) is the highest. However, the second trough is at the same level as the first one. This is the difference between the QM and the Head and Shoulders patterns.
The inverse Head and Shoulders consists of three lows and two peaks, where the second trough (head) is the lowest, and the second top is at the same level as the first.
To make it easier, draw a line, a so-called ‘neckline’, through the two troughs in a bearish formation and the two maximums in a bullish one. If the neckline is horizontal, it's the Head and Shoulders. If it's angled, it's the Quasimodo.
The table below highlights the structural and execution differences:
Feature | Quasimodo (QM) | Head and Shoulders (H&S) |
Structure | Three peaks (or troughs) with the swings between the head and the second should breaking prior structure in the opposite direction | Three peaks (or troughs) where the two swings between the head and shoulders sit at roughly the same level |
Neckline | Angled or sloped, connecting unequal swings | Horizontal or near-horizontal, connecting two equal swings |
Entry trigger | Right shoulder formation after a failed continuation | Price breaks the neckline after the right shoulder |
Entry timing | Earlier in the reversal, often before neckline interaction | Later, after neckline confirmation |
Confirmation | Reversal candles or divergence | Neckline break with volume or retest |
Stop-loss | Beyond the head | Above/below right should or per risk-to-reward ratio |
Take-profit | Second swing low or high (the broken structure) | Distance from head to neckline projected from the break point |
The practical effect of these structural differences:
Although patterns are reliable technical analysis tools, they must be validated.
Confirmation works in a priority order. Price structure comes first: the head must clearly break the prior swing, and the right shoulder must form below (or above) it. Divergence on RSI or MACD comes second, strengthening the signal where momentum disagrees with price. A moving average crossover near the right shoulder comes third, acting as a trend-bias filter.
Timing matters as much as the signal itself. Confirmation that prints before or at the right shoulder is treated as proactive. A signal that appears only after the right shoulder reverses adds weight but reduces the entry window.
RSI and MACD signal a trend reversal in several ways, but the divergence method is the most dependable.
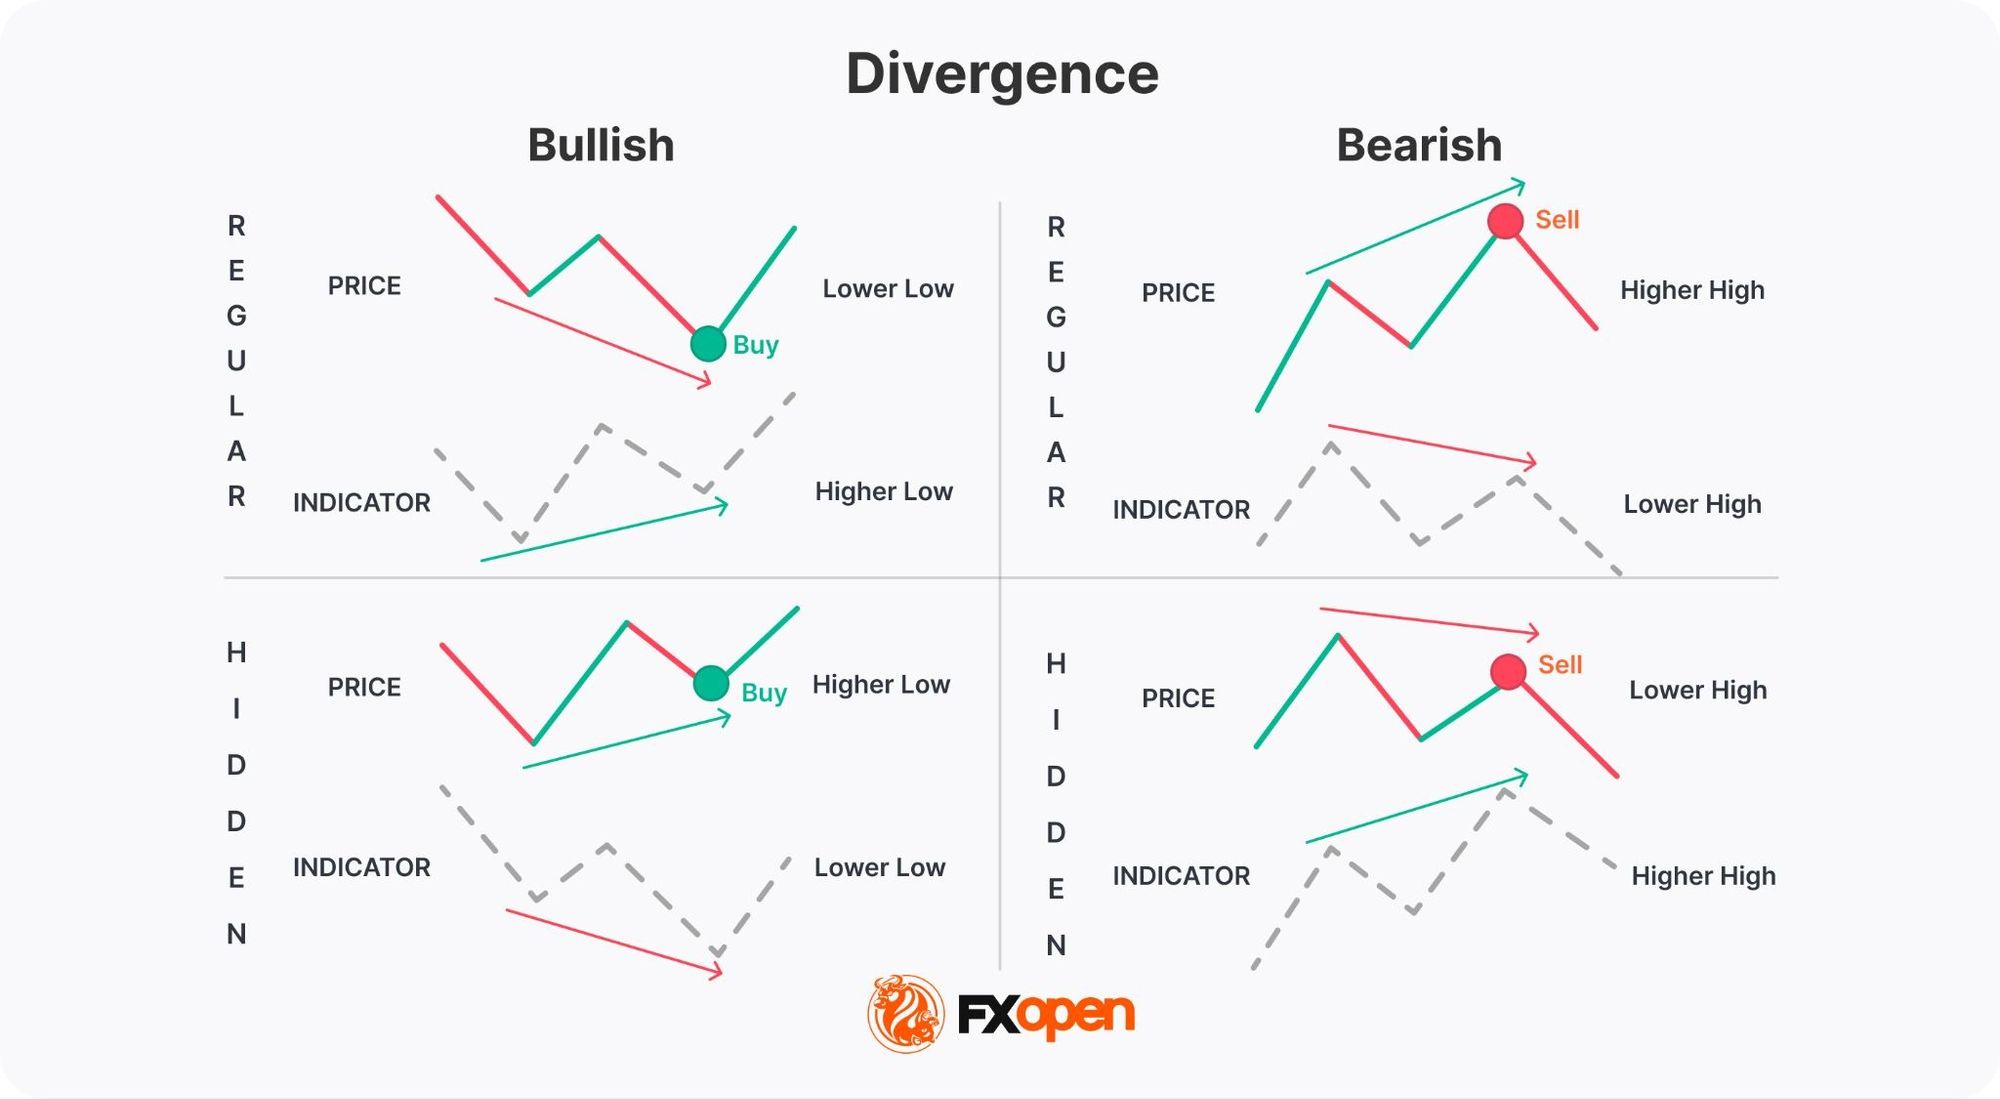
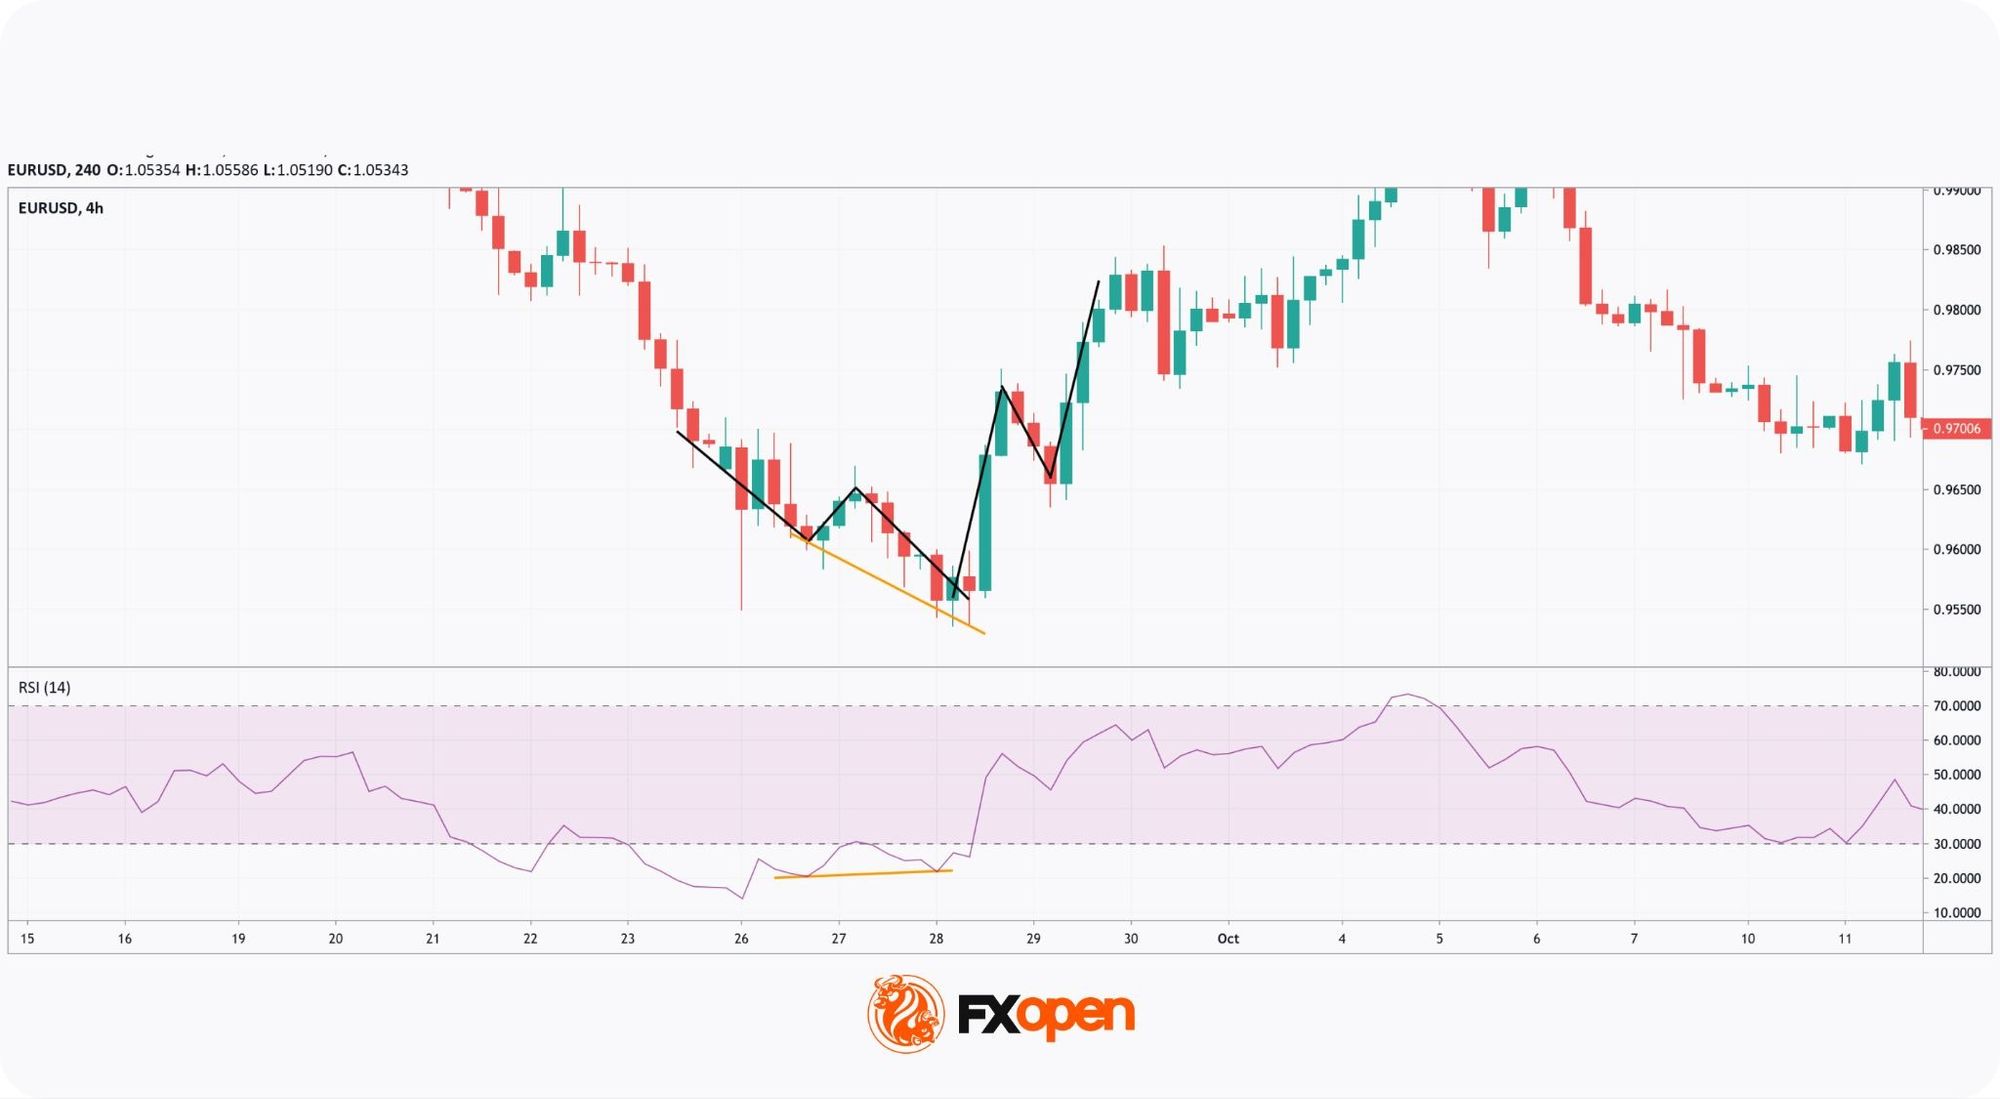
The chart above shows a regular bullish divergence between the price chart and the RSI indicator. As the RSI formed a higher low and left the oversold area, you can anticipate a price reversal. Once the second shoulder of the Quasimodo appears, the market creates conditions for a buy trade.
Divergence strengthens a QM signal when it prints between the head and the right shoulder, on the same timeframe as the pattern. It weakens when:
A simple moving average is widely used to confirm a trend reversal. You will need two MAs with different periods, depending on the timeframe you trade on. 50-, 100-, and 200-period MAs are typically used on high timeframes, while 9-, 12-, and 21-period MAs are more popular on shorter-term periods.
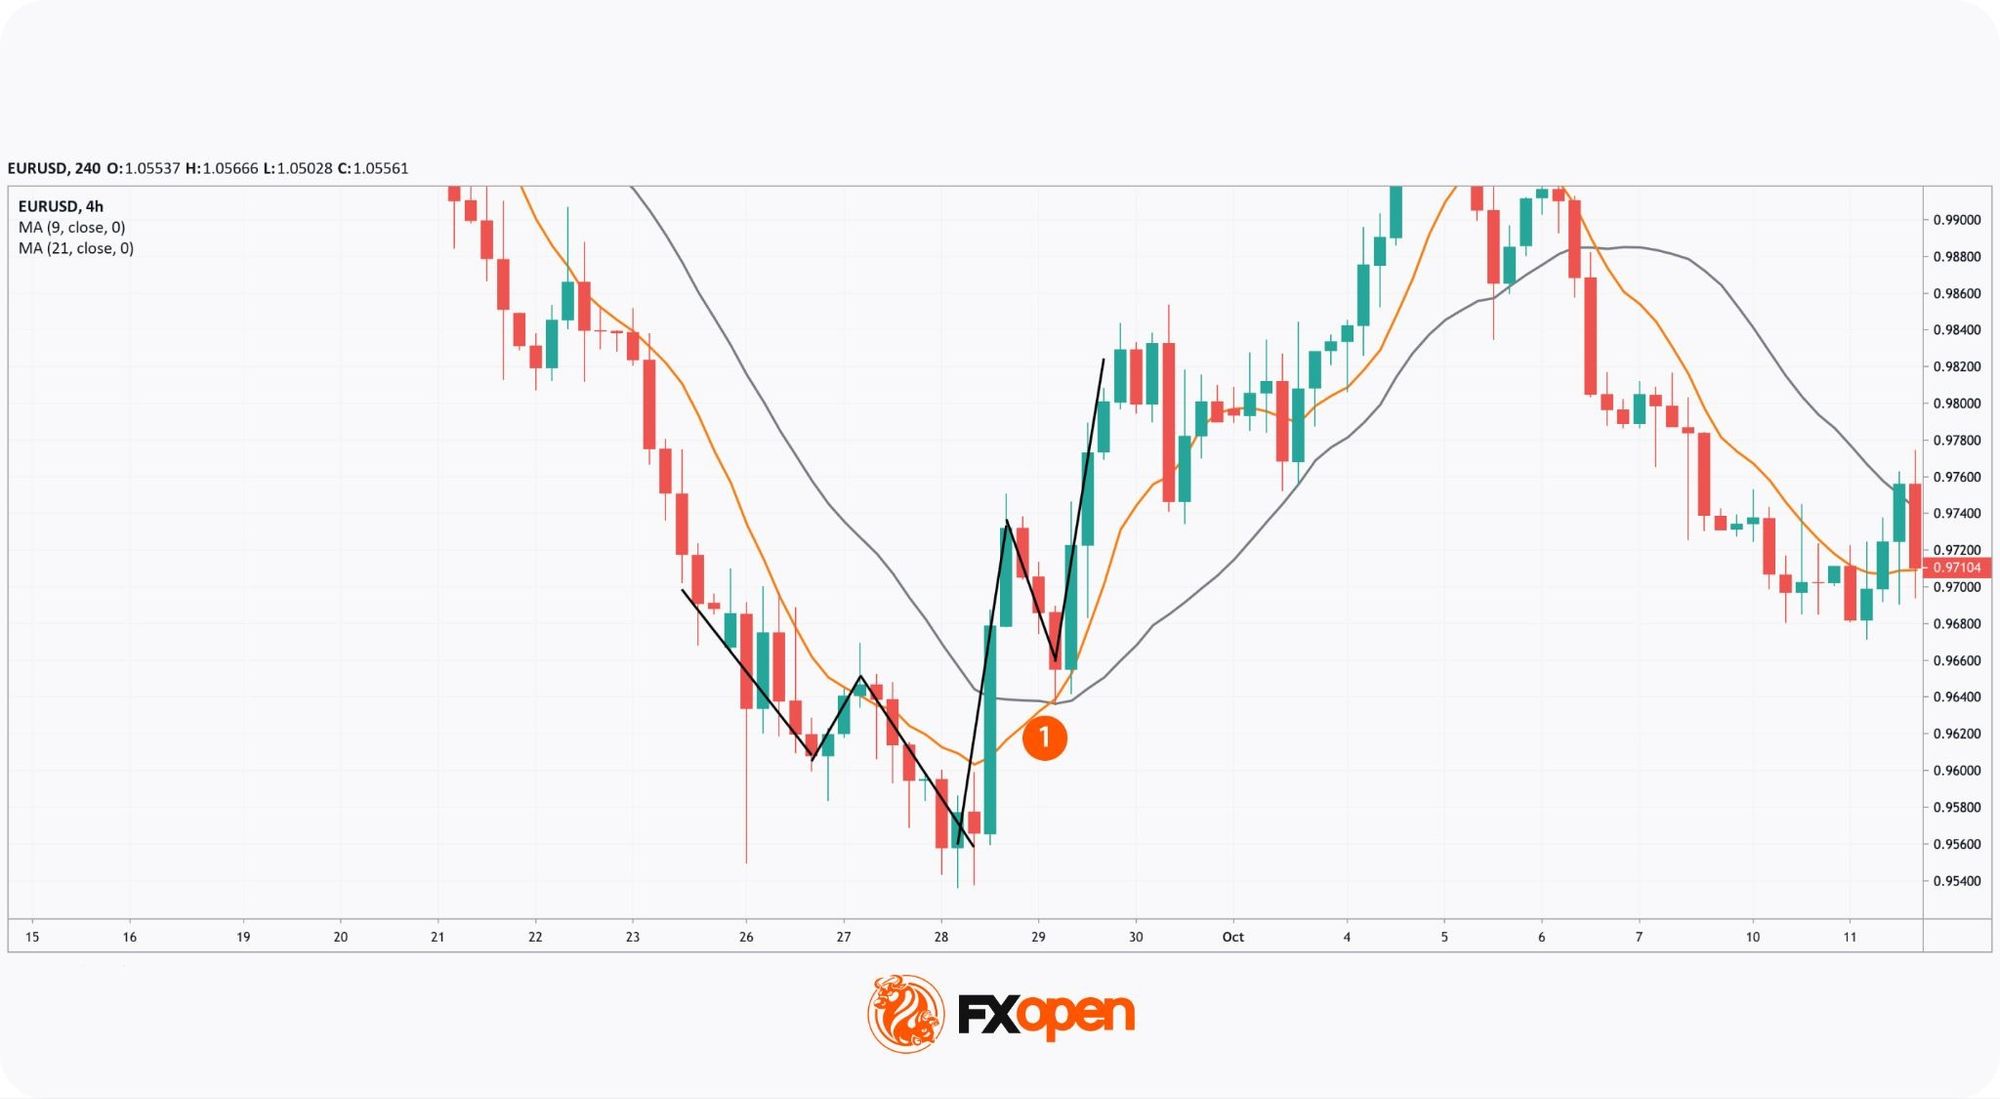
Let’s look at the 4-hour chart of the EUR/USD pair. The price formed an inverse QM. When the second bottom appeared on the chart, a 9-hour MA crossed the 21-hour MA from bottom to top (1). It's a so-called golden cross that signals an upward movement. As the cross occurred before the price formed the third bottom of the QM, you could open a buy trade at the second shoulder with a strong confirmation.
MA periods should align with the trade's timeframe. A QM on the 4-hour chart pairs naturally with a 9 and 21 MA, since those react fast enough to confirm the right shoulder. A daily QM calls for 50 and 200 MAs, which filter noise and reflect institutional trend bias.
Using short MAs on a high-timeframe QM produces too many crossovers and weakens the confirmation. Using long MAs on a short-timeframe QM lags the entry and may miss the reversal entirely.
If you want to practice spotting the QM pattern, you may consider using FXOpen’s TickTrader trading platform.
Before executing a Quasimodo trading strategy, traders typically run through a checklist that combines pattern validity, confirmation, and risk control:
Pattern validity:
Confirmation:
Risk control:
Additional reminders:
When trading the QM pattern, traders often fall into common mistakes:
The QM pattern is a reversal structure built on a failed continuation followed by a break of prior swing. Its execution rules tie entries to the right shoulder, stops to the head, and targets to the broken swing.
Confirmation through price structure, divergence, and moving average alignment strengthens the signal but does not replace it. A Quasimodo trading strategy is considered to work when the prior trend is well-defined and risk-to-reward measures at least 1:1.
Traders interested in applying these execution rules can open a trading account at FXOpen to test the QM pattern across forex and CFDs on stocks, indices, and commodities.
In trading, the Quasimodo definition refers to a reversal pattern that signals a potential change in the trend direction. It indicates a shift from an uptrend to a downtrend (bearish Quasimodo) or a downtrend to an uptrend (bullish Quasimodo). Traders use it to identify entry and exit points.
The Quasimodo consists of three peaks and two troughs in the bearish pattern and three troughs and two peaks in the bullish pattern. The middle peak or trough (head) is the most prominent, flanked by two smaller shoulders.
Traders use the Quasimodo pattern to enter trades at potential reversal points. Typically, they look to sell near the right shoulder in a bearish QM or buy near the right shoulder in a bullish QM. The invalidation level is usually set just beyond the head, while profit targets are placed at the closest swing.
The QM meaning in crypto* is the same as in other markets. The Quasimodo signals potential trend reversals in digital assets. The reliability of its signals often depends on market conditions and is typically confirmed with indicators like oscillators or those that reflect trends.
Confirmation works in three layers. First, the price structure itself: the head must break the prior swing decisively, and the right shoulder must form below (or above) it. Second, momentum indicators like RSI or MACD showing divergence against price. Third, a moving average crossover that aligns with the reversal direction. A pattern with all three layers carries more weight than one supported by structure alone.
The QM pattern can form on any timeframe, but reliability tends to vary. Higher timeframes (4-hour, daily, weekly) produce fewer setups but with clearer structure and stronger follow-through. Lower timeframes (15-minute, 1-hour) produce more setups but carry more noise, more false breaks at the head, and more shallow shoulders that fail to develop. Most traders apply the pattern on medium-term timeframes.
*Important: At FXOpen UK, Cryptocurrency trading via CFDs is only available to our Professional clients. They are not available for trading by Retail clients. To find out more information about how this may affect you, please get in touch with our team.

