
Render (RENDER) is facing renewed selling pressure on March 27, 2026, as the token declines nearly 5.97% amid weakening market momentum. The move reflects fading buying interest across the broader crypto market, with traders showing increased caution.
At the time of writing, Render trades near $1.66, marking a continued downtrend from recent highs. The token’s market capitalization stands at $869.74 million, as per the CoinMarketCap data.
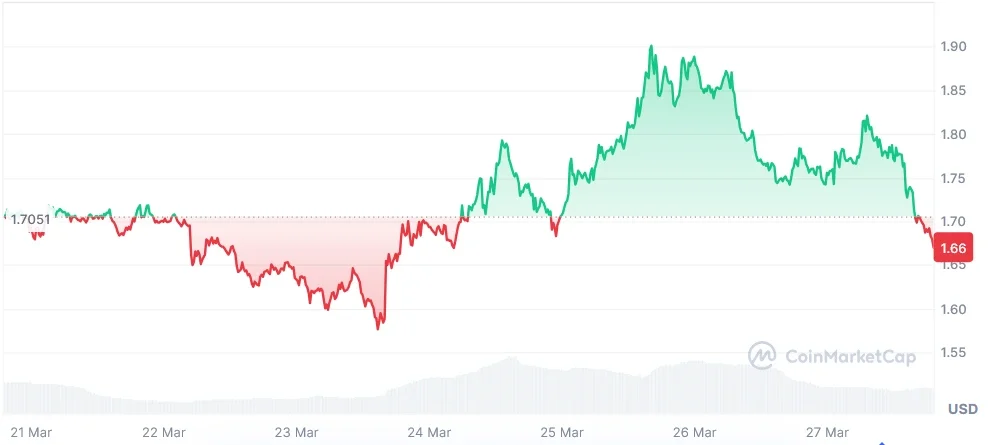
While 24-hour trading volume has dropped to $55.47 million, signaling reduced trading activity and declining liquidity. The weekly performance shows a 1.8% decline, reinforcing the presence of a short-term bearish trend.
Also Read: RENDER Price Analysis: $2.71 Break May Signal Trend Shift
Render continues to trade within a well-defined downtrend structure, having fallen from above $5.00 to lows near $1.50. This sequence of lower highs and lower lows confirms sustained bearish control in the market.
The price remains below the 200-day EMA, currently at $2.139, a level that has continued to act as strong resistance since December.
While there has been a lack of momentum in trying to move back towards the $1.80-$1.90 range, $2.00 remains a hurdle. The near-term risk of a stronger rejection is at $2.139.
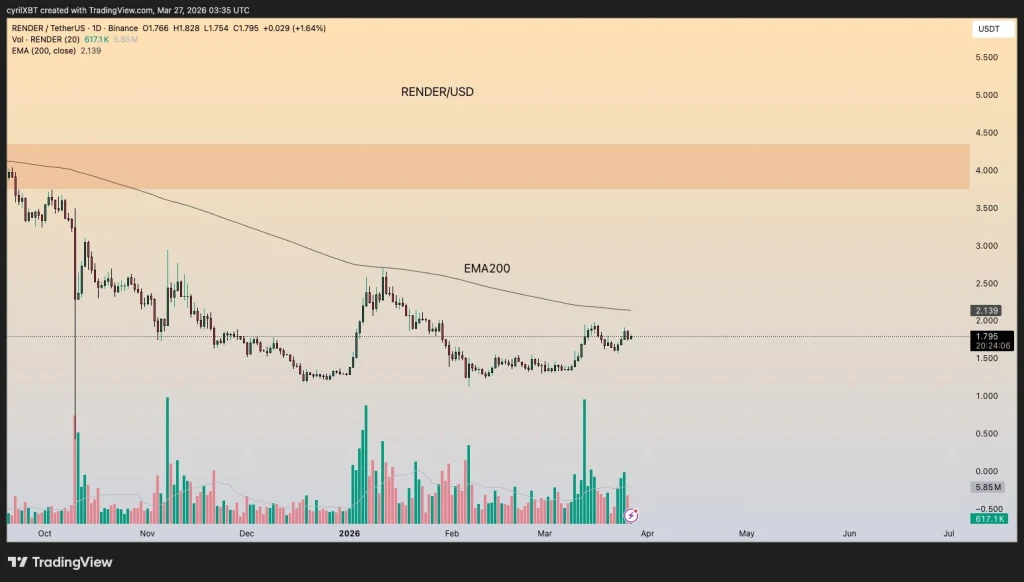
The volume movements are consistent with this interpretation. Falling participation suggests that the demand for the asset has fallen, leaving it vulnerable to continuing a sideways move between $1.50 and $2.10.
If this support of $1.50 were to break, targets for a downside move could be towards $1.30 and even $1.00. For a bullish reversal, a strong breakout above $2.15, with strong volumes, is required for a move towards $2.50 and even $3.00, says crypto analyst CyrilXBT.
The momentum indicators point to a neutral to weak phase in the market. The RSI stands at 51.46, while the moving average of the RSI stands at 60.28. This shows that the market has a neutral momentum after a fall from the overbought region.
However, the price momentum has slowed down, indicating a consolidation in the market or a potential bearish move in the future, even though the RSI remains above 50, indicating a mild bullish influence.
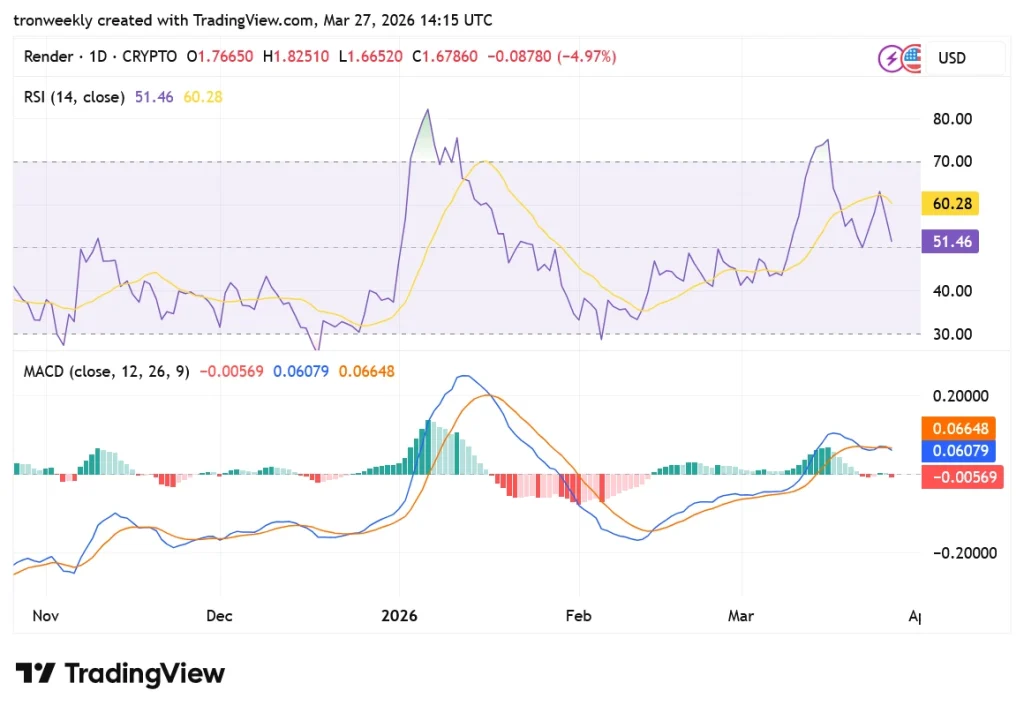
The MACD stands at -0.00569, the signal line at 0.06079, and the histogram at 0.06648. It appears that the momentum is slowing down after a run of buying pressure.
The lines are getting closer to each other, indicating a bearish crossover that may signal a short-term trend change or a consolidation phase.
This article contains market analysis and price predictions. These are not guarantees. Crypto markets are volatile. Always DYOR. Not financial advice.
Also Read: RENDER Falling Wedge Breakout Eyes $3.60 Price Target


