Ripple’s native token, $XRP, reclaimed the $1.50 price level. This move comes after weeks of tightening volatility, where the asset was compressed within a massive technical structure. As the broader crypto market shows signs of a renewed bullish cycle, XRP's recent price action suggests that the long-awaited move toward psychological resistance levels may be underway.
The current technical setup confirms that XRP is targeting the $2.00 milestone. This projection is based on a "measured move" following the breach of a multi-week consolidation pattern. If XRP-USD can maintain its position above the $1.45 support zone, the next liquidity pocket sits between $1.85 and $2.10.
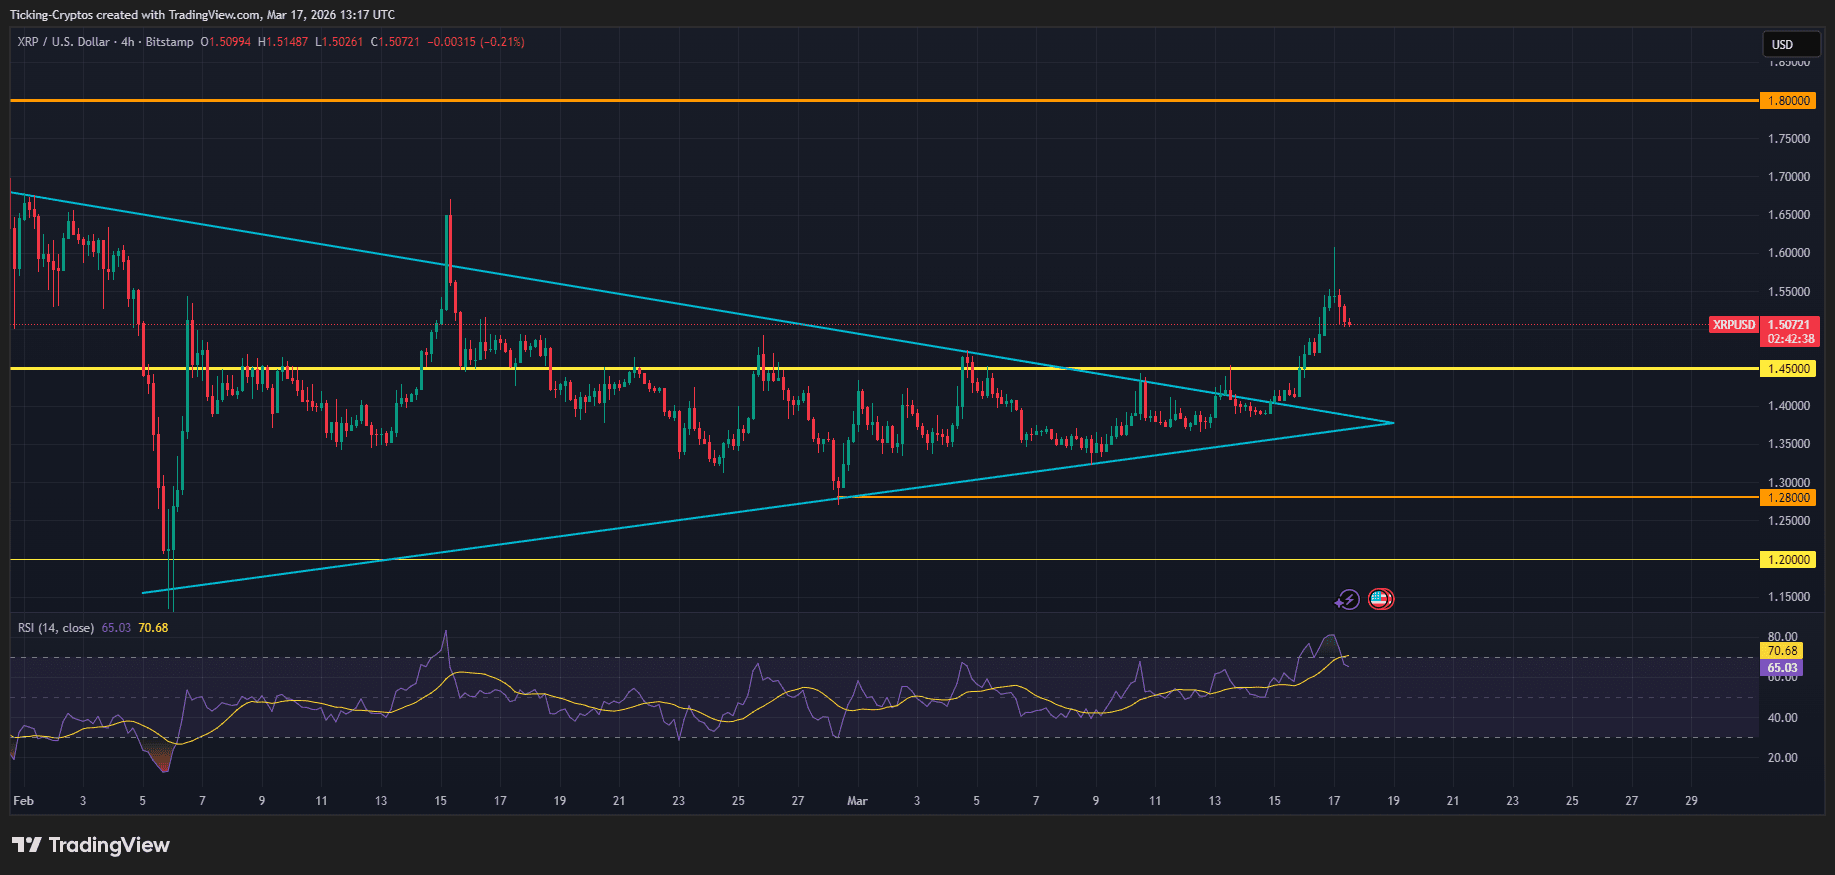
A symmetrical triangle is a chart pattern characterized by two converging trendlines connecting a series of sequential peaks and troughs. In XRP’s case, this pattern represented a period of "equilibrium" where buyers and sellers were in a deadlock. Typically, a breakout from this formation indicates that the prevailing trend—in this case, the bullish momentum from late 2025—is ready to resume with high volume.
The most critical development in the recent XRP-USD price action is the upward breach from the triangle formation. Since February 2026, XRP has been making lower highs and higher lows, narrowing into an apex near the $1.38 mark.
On March 14, trading volume surged by over 300%, providing the necessary fuel for XRP to pierce the upper descending trendline. This "breach" was not merely a wick but was followed by a daily candle close above the resistance, effectively flipping it into a support floor. Technical analysts often view this specific type of exit from a triangle as a signal that the "accumulation phase" is over and the "markup phase" has begun.
Beyond the triangle breakout, several other indicators point toward a continued rally:
| Level | Type | Significance |
|---|---|---|
| $1.38 - $1.42 | New Support | The previous triangle resistance now acts as a floor. |
| $1.56 | Current Pivot | XRP is consolidating here to build momentum for the next leg. |
| $1.80 | Minor Resistance | A historical supply zone from early 2026. |
| $2.00 | Major Target | The primary psychological and technical goal for the current rally. |

