
SEI (Sei) is experiencing bearish pressure with a decline in its value and is also showing resilience for a breakout despite market volatility. The price over the last 24 hours has dropped by 9.03%, and over the last week, it dipped by 9.12%.
At the time of writing, the asset is trading at $0.2865, with a 24-hour trading volume of $231.51 million, up by 124.13% over the last 24 hours. The token has a market capitalization of $1.75 billion, which is down by 9%.
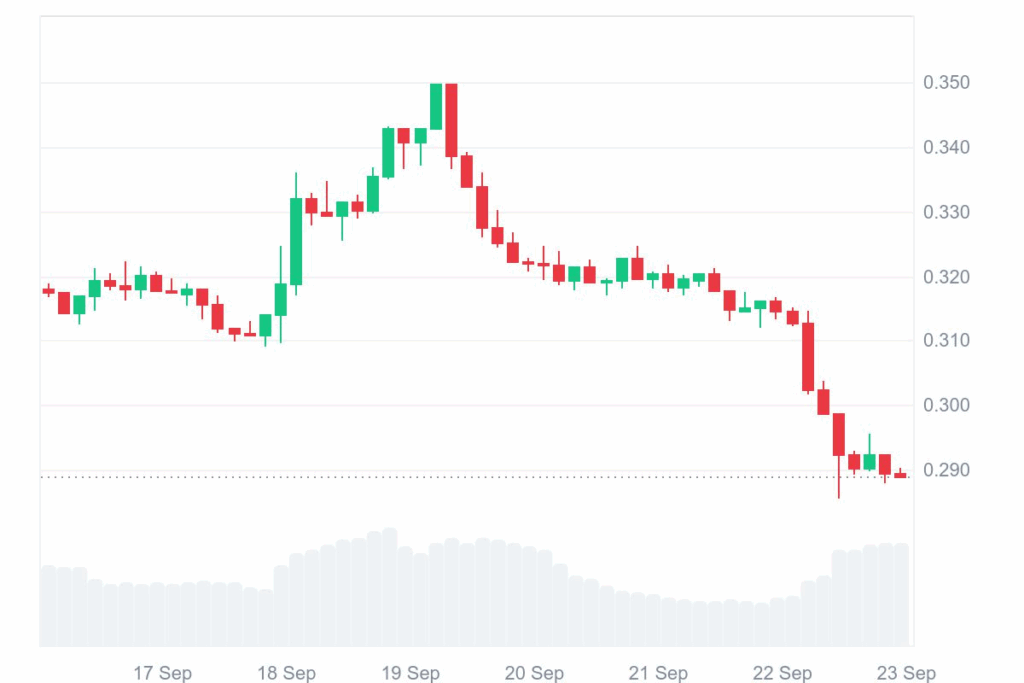
Source: CoinMarketCap
Also Read: Sei Network Sees Record $609 Million DeFi TVL as Gaming Ecosystem Expands
The crypto analyst, Hailey LUNC, revealed that SEI is currently forming a symmetrical triangle pattern on the daily chart, a setup that often signals a strong directional breakout ahead. With selling pressure gradually easing, the market sentiment appears to be leaning in favor of the bulls. Traders are closely watching this tightening range as momentum builds for the next move.
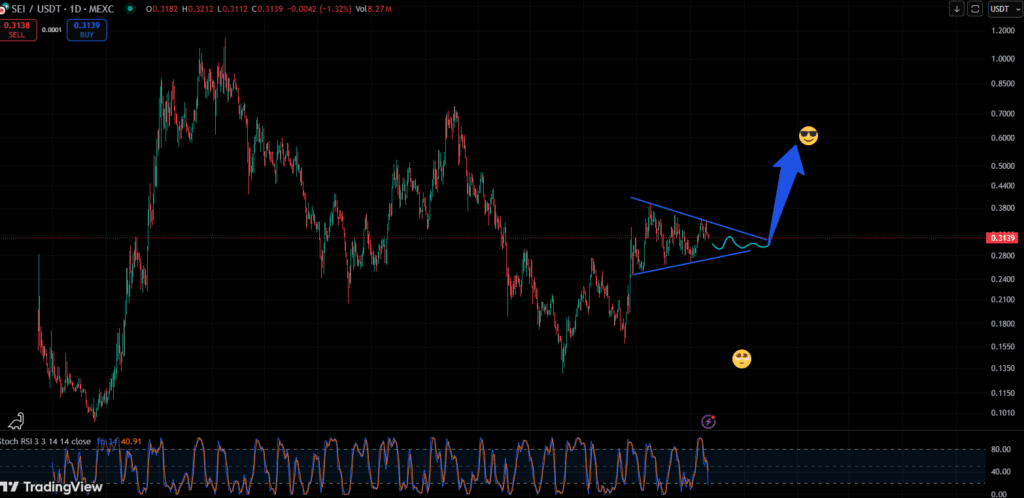
Source: X
The critical level to monitor remains $0.35, which has been an amazing resistance zone in recent weeks. A strong breakout above would trigger a swift rally, and technical targets would then move to $0.44 in the near term. Until then, SEI sits in a critical decision zone, waiting to signal what its next major trend is.
According to data from Cryptorank, performance in July 2025 grew by a humble 4.34%, marking a good start to the third quarter. The trend slumped in August by 3.11%, marking a minor correction. The trend became positive once more in September, marking a minor comeback of 1.98%.
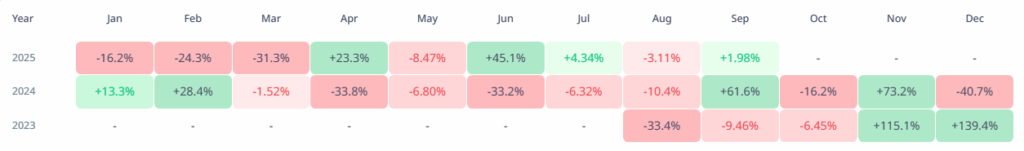
Source: Cryptorank
The Jul–Sep 2025 period was quite stable compared to past months in the period as a whole. The movements were minor, and there were no excessive losses or excessive gains here. It would suggest a quarter of stability and not volatility.
The RSI stands at 49.83, having dropped below its 53.59 moving average. This indicates weakening sentiment and momentum turning bearish from bullish. Since the RSI is just at and around the midpoint (50), it indicates confusion in the market. If it keeps falling and moves closer to, or below, 40, it would affirm increasing bearish pressure in later weeks.
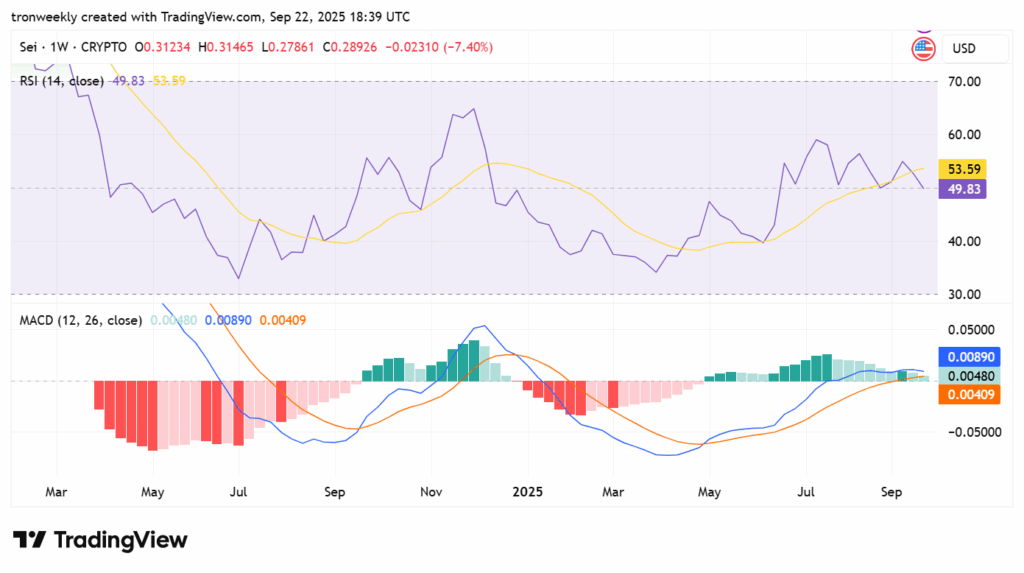
Source: TradingView
The MACD shows a bullish setting, as the MACD line continues to be higher than the signal line. The histogram is contracting, indicating fading bullish strength. If MACD breaks down below the signal line, it would confirm a bearish crossover, reinforcing the downtrend being foreseen by the RSI. Overall, both indicators reflect a loss of bullish strength and a possible bearish reversal if current trends prevail.
Also Read: Sei Price Prediction: Can SEI Break $0.49 Resistance for a Rally to $0.89?


