SEI is currently testing a key demand zone after a long period of declining price action, indicating a potential reversal point for the cryptocurrency. Analysts say that this demand zone could be a strategic place to accumulate cryptocurrency as a long-term investment.
At the time of writing, SEI is trading at $0.06434, with a 24-hour trading volume of $44.02 million and a market capitalization of $436.66 million, according to CoinMarketCap. Over the last 24 hours, SEI has dropped 2.26%.

Source: CoinMarketCap
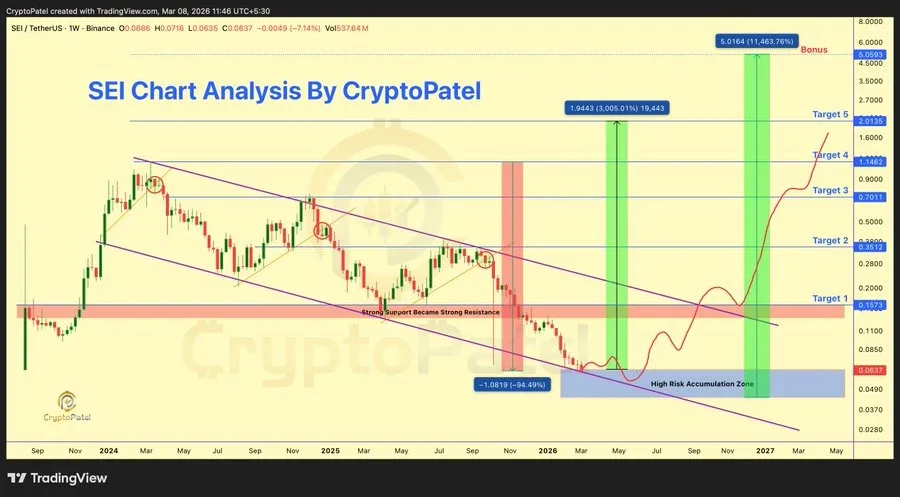
Crypto analyst Crypto Patel explains that SEI is nearing a “do or die” area that represents a crucial demand zone for the coin. Following a steep decline of about 94% from its all-time high of $1.145, SEI is seen to be testing the lower boundary of a descending channel.
Patel refers to this area as a high-risk area for investors to accumulate the coin before a potential price bounce.
Source: X
SEI’s price chart indicates a dominant descending parallel channel formation since 2024, characterized by lower highs and lower lows. The former support level of $0.160 now acts as a major resistance level, a classic example of a support-turned-resistance level.
Currently, SEI’s range of $0.065-$0.045 represents a typical discount pricing within the lower boundary of the channel.
Patel’s long-term SEI price targets are $0.157, $0.351, $0.701, $1.146, $2.013, and $5.05. These targets become invalid if the price closes below $0.040 on a weekly chart. Patel’s targets were not based on support levels since they do not work anyway.
From a technical perspective, SEI seems to have weak momentum. Using the RSI indicator, it’s clear that SEI is oversold, with a reading of 27.61 and a signal line of 31.75. However, it’s also clear that the price is still far from key moving averages such as $0.11931, $0.19970, and $0.29969.

MACD is at -0.04516, which is below the signal at -0.04368. The histogram is -0.00148. This indicates slightly more selling than buying. The downtrend is likely to continue in the near term.
Also Read | XRP Breakout Alert: Historical Trends Hint at 2,000% Potential Move
However, if SEI is able to absorb the selling pressure at this macro-level demand zone, it may be setting up for a substantial markup phase in 2026-2027.
This may be due to ecosystem expansion and the resurgence of interest in layer 1 projects. For long-term investors, the current price level may be a strategic entry point.
Also Read | SUI Eyes $20 Long-Term Target if Fibonacci Support and Trendline Hold

