
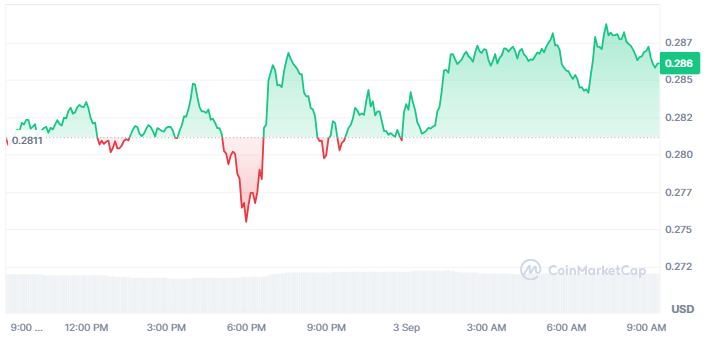
SEI has recorded a slight upward trend from the previous 24 hours with a 1.61% rise to $0.2862. Market capitalization held firm at $1.71 billion, maintaining alignment with its unlocked supply. Trading volume was $155.2 million with a slight 0.89% growth in cumulative liquidity in 1 day.
Analyst Ali Marteniz highlighted SEI’s market structure on X, pointing toward a potential rebound phase. The token is currently signaling a buy near the lowest end of its trading channel. By tradition, that technical setup tends to precede positive movement for digital assets.
If SEI holds its uptrending channel formation intact, the coin can edge closer to that $0.37 resistance level. Channel breakouts are closely monitored by traders seeking short-term profits.
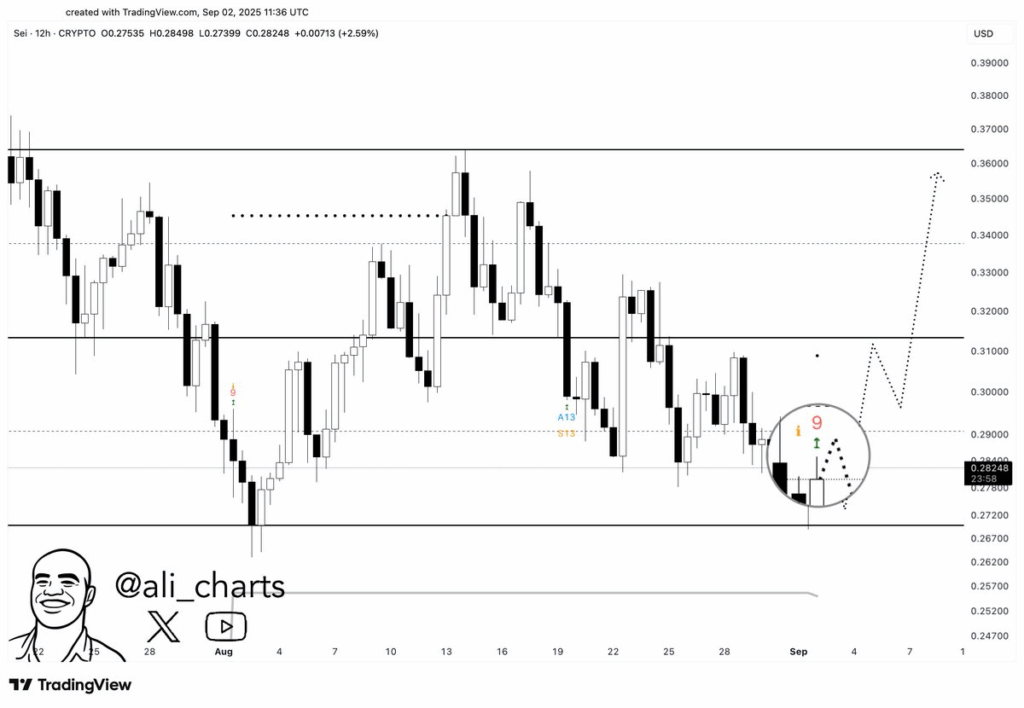
SEI has recovered from below the daily chart’s lower Bollinger Band. The move prevented the token from falling to the 38.2% Fibonacci retracement level of $0.2524. The Bollinger Bands remain in a flat setup, signaling low volatility but positive indicators for likely chances of reversal.
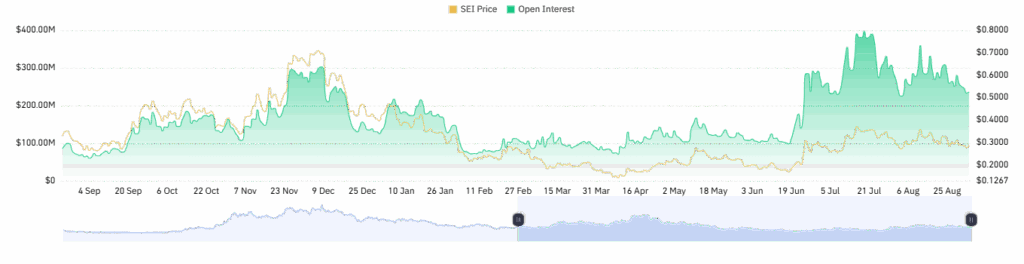
CoinGlass data reveals Open Interest (OI) is presently $233.28 million, having dipped down from $245.17 million last week. The significant dip suggests leveraged investors are decreasing their exposure. The sharp pullback reflects a cautious market sentiment, with investors choosing a wait-and-see policy in mixed momentum.
Also Read | SEI Technical Outlook: Wedge Pattern Signals Breakout Toward $0.34
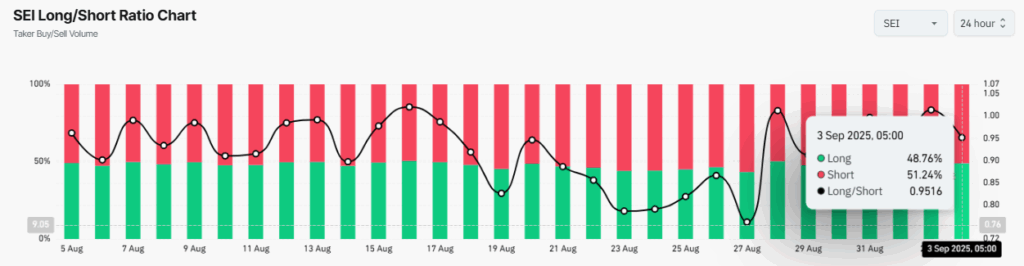
Further data indicate SEI markets’ downward pressure. Taker sell volume dominates at 51.24%, forcing the long-to-short ratio to 0.9516. The skewed balance indicates that bearish players lead by a thin margin, negating near-term optimism that was positive for bulls despite developing positive technical indicators on the chart.
Momentum indicators also indicate cautionary signals. The Moving Average Convergence Divergence (MACD) indicator slopes downwards along with its signal line, signaling increasing bearish momentum. Concurrently, the Relative Strength Index (RSI) of 43 is below the neutral midpoint and reaffirms a mildly bearish short-term price structure of SEI.
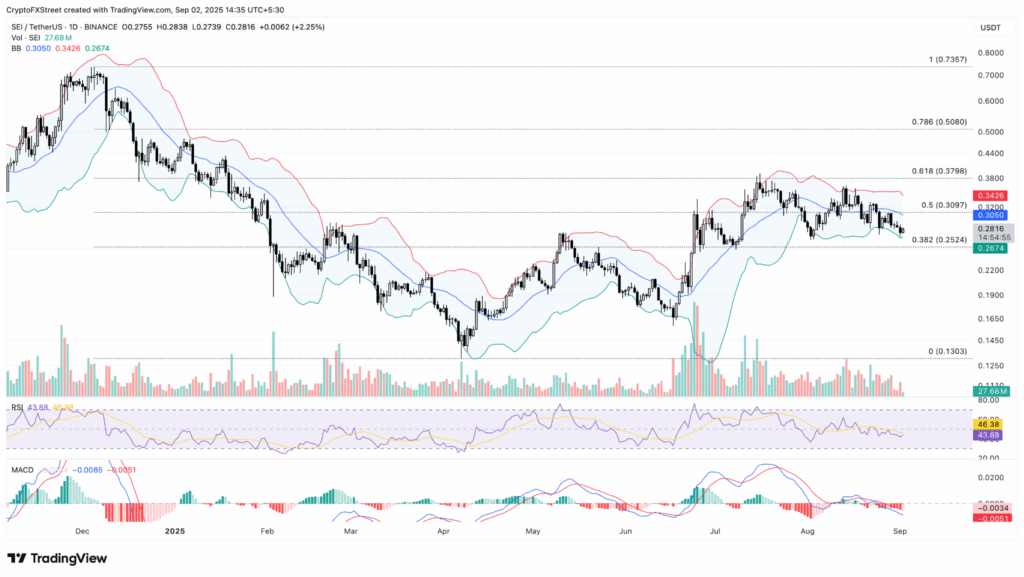
If SEI falls below its 38.2% Fibonacci level of $0.2524, it can potentially hit the $0.2000 psychological level. A breakdown would spoil near-term bullish hopes, further supporting a bearish continuation.
Also Read | Coincheck Secures Entry into European Crypto Market via Aplo Acquisition

