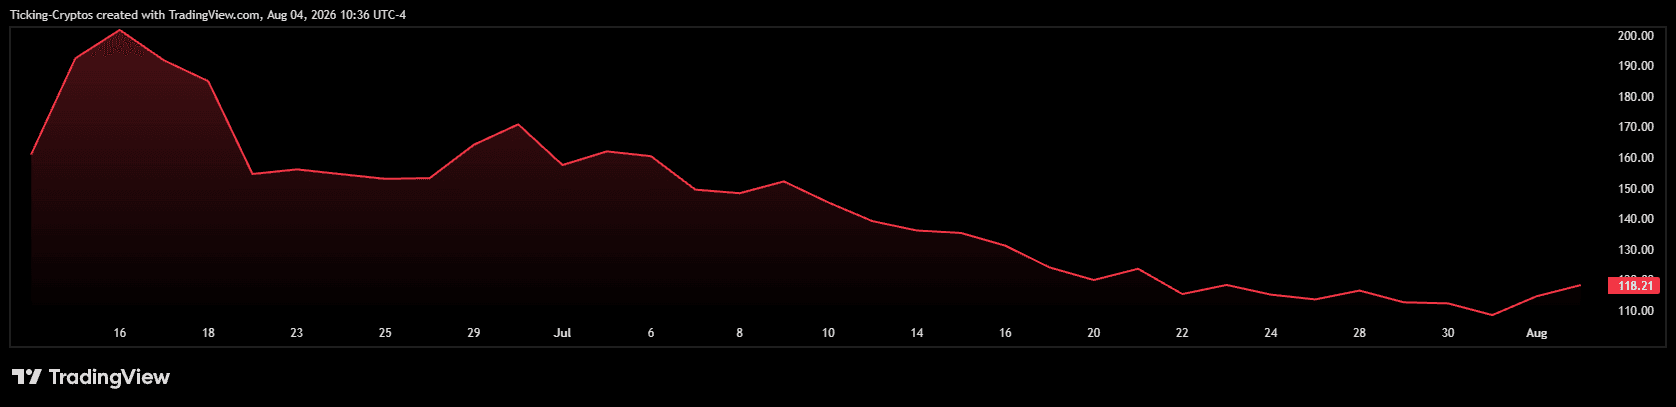
Seven weeks ago SpaceX pulled off the largest listing in stock market history. Today the stock trades below the price its own IPO investors paid, and the chart tells the story more clearly than any headline has.
$SPCX changed hands around $118.21 on Tuesday morning. That is roughly 44% below the closing record of $211 set on 16 June, about 12% under the $135 offer price, and it comes two sessions after the stock printed an all time low of $104.83. The company reports its first quarterly results as a public company after the closing bell tonight, and its first insider lockup tranche expires on Thursday.
Two events, two days apart, on a stock that has spent seven weeks going one direction.
The deal itself was a success by every conventional measure.
SpaceX priced at $135 per share on 11 June and began trading on the Nasdaq on 12 June, raising $85.7 billion in total. The order book ran more than twice oversubscribed, with roughly $150 billion of demand chasing the raise, and around 30% of the allocation was reserved for retail investors, an unusually large share for a deal of this size. The retail tranche was exhausted before pricing closed, and many investors who applied through Robinhood, Fidelity, SoFi, Schwab, or E*TRADE received partial fills or nothing at all.
The stock opened at $150, closed its first day at $160.95, and by 16 June it had touched an intraday high of $225.64. At that point the market was valuing SpaceX near $2.1 trillion.
One detail from the deal explains much of what followed: SpaceX floated less than 5% of its outstanding shares. A very small float met very large demand, which is a reliable recipe for a high print, and an equally reliable recipe for what happens when that float expands.
Looking at the chart from listing to now, the move splits into five distinct phases.
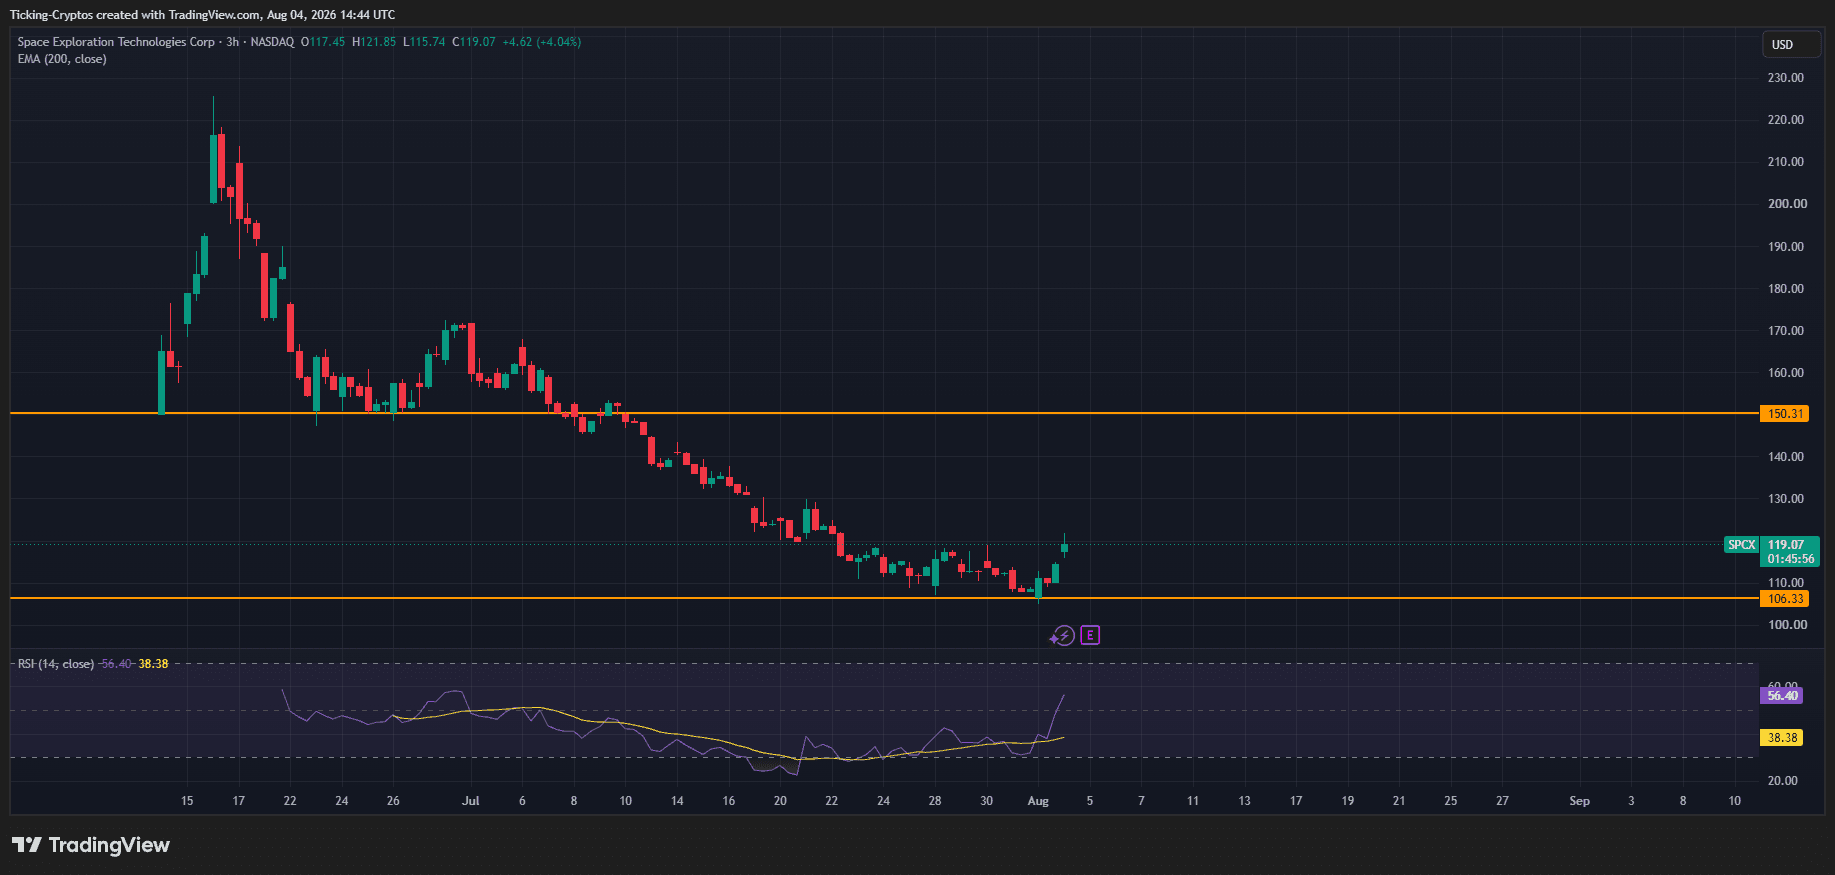
One reversal candle after a 50% drawdown is not a trend change. It is a stock that got oversold into two binary events.
Four overlapping pressures, and only one of them is about the business.
Consensus sits at roughly $6.8 to $6.9 billion in second quarter revenue and a loss of about $0.23 per share, though the range of analyst estimates runs from a $1.26 loss to a $0.33 profit. That spread tells you how little the market actually knows.
Three numbers carry the weight.
On the chart, the immediate resistance is $123, which is where the July slide accelerated. Above that, $150 is the next meaningful shelf, and it is also roughly where the trend broke in Phase two.
Below, $105 is now the reference low, with $100 as the round number that would likely attract attention if it goes. The $175.50 level is worth knowing for a different reason: if SPCX trades 30% above the IPO price on five of any ten sessions, another 10% of restricted shares release early. At $118, that trigger is nowhere close.
Analyst positioning is strikingly disconnected from price action. Twenty eight analysts cover the stock, 27 of them rate it a buy, and the average 12 month target is $236.71, with estimates spanning $62 to $800. Needham raised its target to $250 in mid-July, the same week the stock broke its IPO price. Phillip Securities initiated at Sell on 31 July. Ark Invest bought $16.6 million on the way down.
The setup is unusually clean, which is rare and worth saying plainly.
If earnings show Starlink margins expanding and management gives credible capital expenditure guidance, a 50% drawdown starts looking overdone, shorts covering 28% of the float adds fuel, and $123 then $150 come into play. If the numbers land soft or guidance is vague, Thursday's lockup stops being a scheduled event and becomes a supply problem into a market that has absorbed this stock badly since June.
The wider lesson has nothing to do with rockets. A sub-5% float produces a price that reflects scarcity, not consensus. Every holder who bought above $150 was buying a number the float was manufacturing. That mechanism is now unwinding on a schedule that runs through December, and no single earnings report changes it.





