
Shiba Inu (SHIB) fell 3.22% in the latest trading session on March 29, 2026, reflecting increasing short-term bearish pressure across the broader meme coin market.
Despite this, the token still holds a relatively stable performance on the weekly scale. According to the CoinMarketCap data, the token is trading at $0.01470, supported by growing market activity.
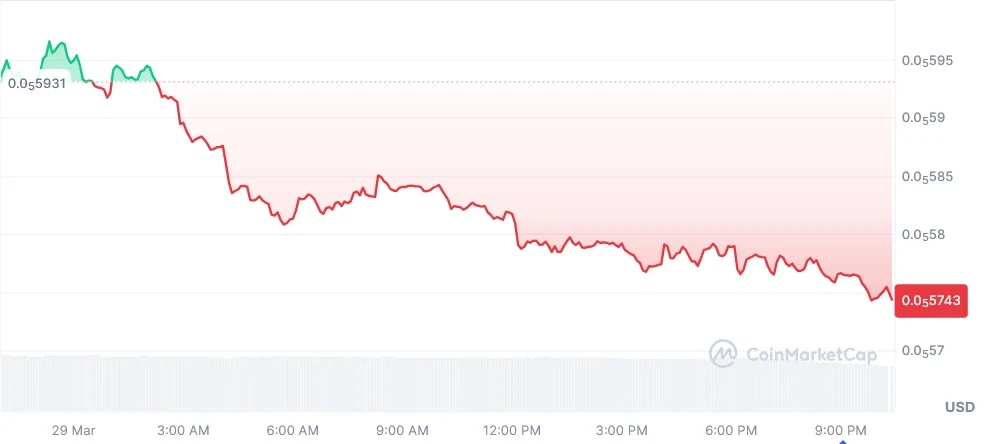
The 24-hour trading volume stands at $60.95 million, reflecting an 18.07% daily decline. Meanwhile, the market capitalization is valued at $3.38 billion, marking a 3.22% drop over the same period.
Also Read: SHIB Consolidation Phase Signals Possible Rally to $0.000006800
Shiba Inu (SHIB) continues to trade within a clear falling wedge pattern on the 3-day chart, signaling a potential bullish reversal, according to crypto analyst Jonathan Carter.
The Price is holding firmly above the lower boundary near $0.0000054–$0.0000058, where demand appears strong, preventing further downside and hinting at early accumulation by buyers.
The structure shows tightening price action with consistent lower highs and lower lows, reflecting weakening bearish momentum.
Volume has gradually declined during the downtrend, which aligns with wedge characteristics. Recent candles indicate stabilization, suggesting sellers are losing control while buyers cautiously begin positioning for a potential breakout.
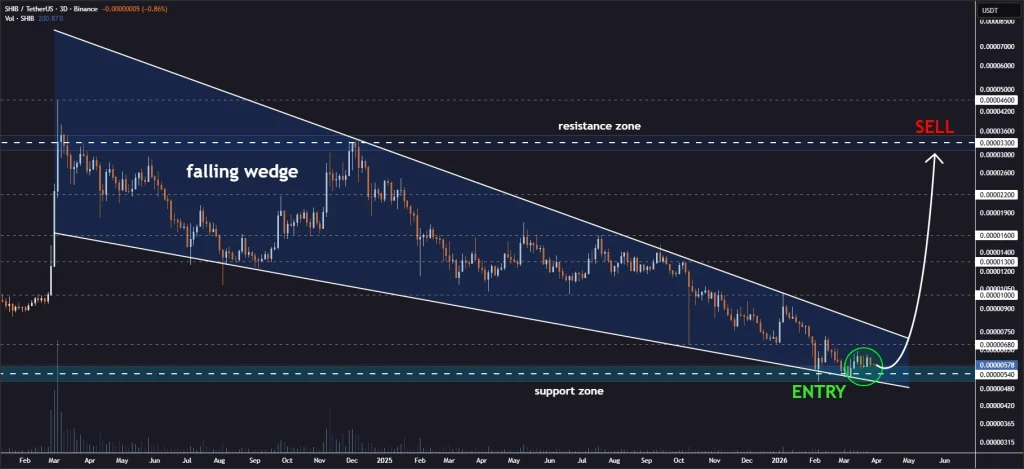
If SHIB can break through this wedge resistance, it could gain significant momentum in no time. The first target will be $0.0000068, followed by $0.0000100, $0.0000130, $0.0000160, $0.0000220, and $0.0000330.
However, a fall in price below its support will negate this possibility and may result in further downward pressure on
According to the TradingView Chart, RSI (14) is currently trading around 35.00-35.46 levels, indicating low trading momentum and a kiss of oversold levels.
This indicates that the overall market has been dominated by selling pressure, but the fall is slowing down. In past market structures, such levels usually indicate a pause or a relief rally as buying interest begins to revive in the market.

The position of the MACD (12,26,9) is near zero, showing almost no directional push. The size of the histogram bars is small, showing low volatility.
The MACD and signal line are closing in on each other, which is an indication that they will cross over. This is an indication that a change in trend or consolidation is about to occur.
The SHIB is in a squeeze within a descending wedge, indicating that it is likely to break out swiftly in one direction or the other.
With the RSI falling and the MACD level, the chances of a trend change or a relief rally are increasing as the bears are backing off.
This article contains market analysis and price predictions. These are not guarantees. Crypto markets are volatile. Always DYOR. Not financial advice.
Also Read: Shiba Inu Whale Dumps 14.5B SHIB After 2 Years, Takes 83% Loss


