
Shiba Inu (SHIB) is moving in a neutral-to-bullish setup, as BTC is consolidating in an upward direction, which impacts the overall market, including altcoins like SHIB. The SHIB price has surged by 3.64% over the last 24 hours and 3.78% over the last week.
According to CoinMarketCap, SHIB is currently trading at $0.000005687, supported by a trading volume of $205.79 million, which has surged by 79.24% over the last 24 hours. Furthermore, its market capitalization stands at $3.35 billion, which is also up by 3.76%.
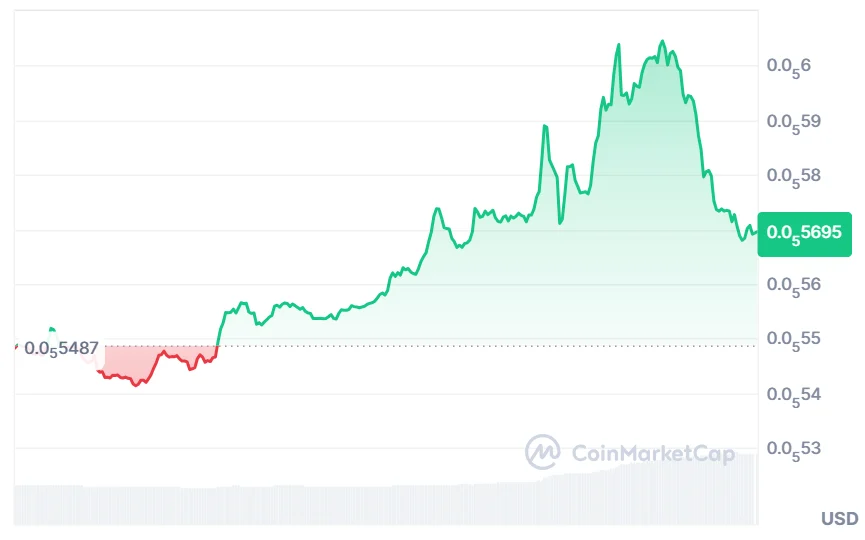
Source: CoinMarketCap
Also Read: Shiba Inu (SHIB) Eyes $0.0000330 Breakout Amid Falling Wedge Support
According to the crypto analyst Javon Marks, SHIB is slowly building up towards a critical juncture as it is forming another falling wedge-like pattern.
In the past, this type of pattern has indicated a significant bullish move, suggesting a possible rise in momentum for the cryptocurrency. Experts are speculating whether SHIB is building up towards another rally.
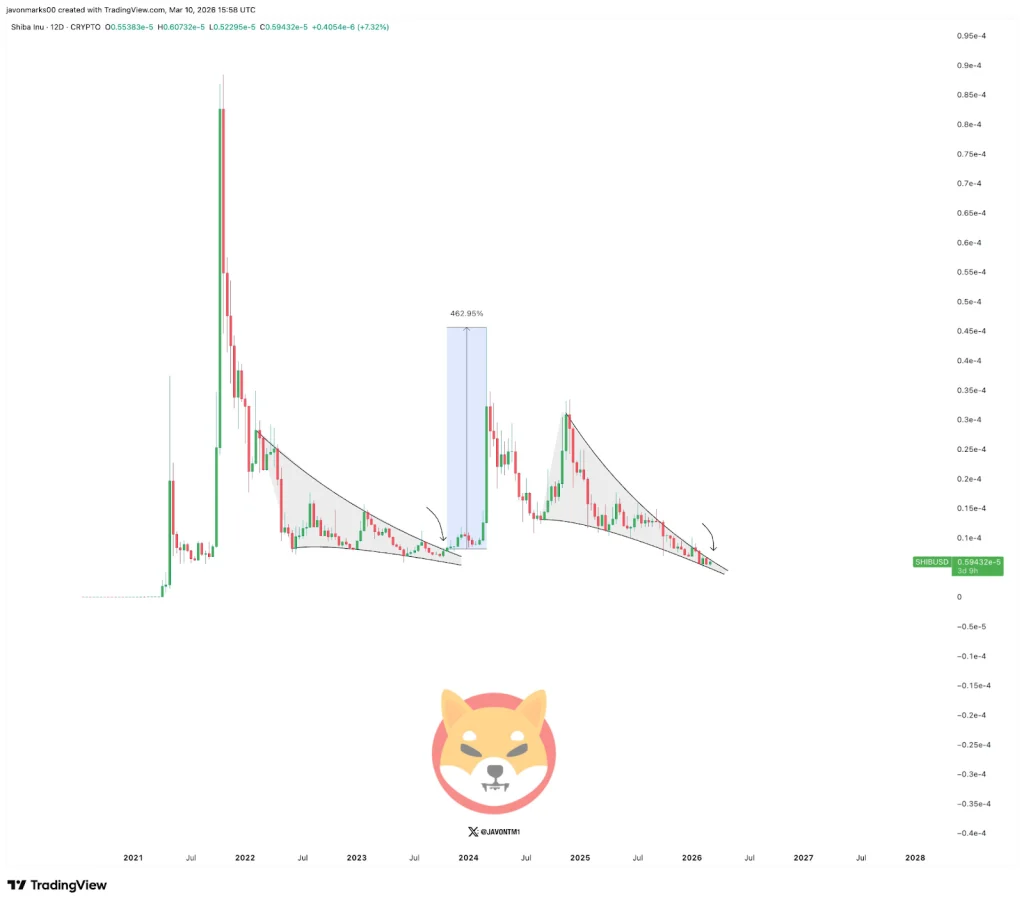
Source: Javon Marks’ X Post
The last Falling Wedge breakout of SHIB saw a massive price increase of 455%. The price reached a peak of $0.000045. Falling wedges are a sign of a period of consolidation, during which the selling pressure diminishes, resulting in a sharp price increase.
This indicates a sharp price increase, and investors are keeping a close eye on the price movements of the token to see if it is ready to explode again.
According to TradingView, the Relative Strength Index (RSI) is at 44.72, which is inching up from its depths. The RSI has moved up through its yellow line at 37.92, indicating that the falling momentum is finally slowing down.
Although it remains below its neutral level at 50, the upward movement indicates that buyers are stepping in to support the current trend.
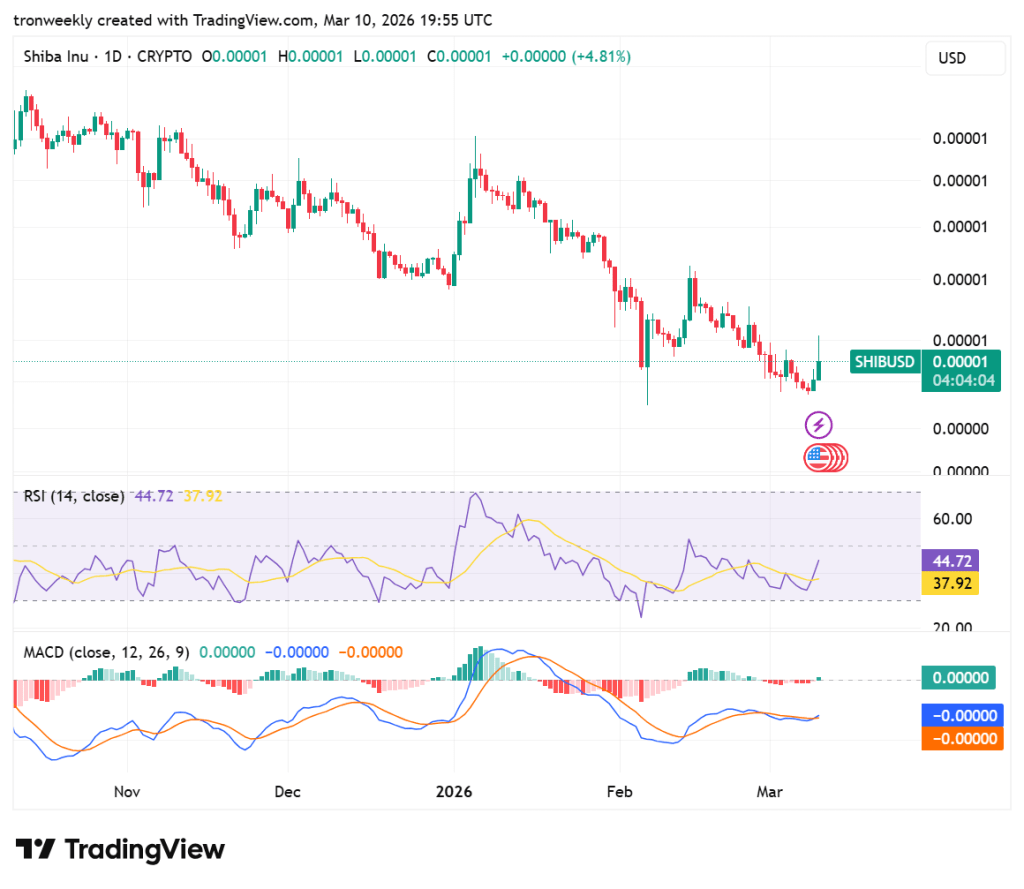
Source: TradingView
The MACD indicator is showing a bullish crossover as the blue line is moving up above the orange line, which is the signal line.
Although the two lines are still below the zero line, the green color of the histogram is indicating a tilt in the momentum as the line is moving up, suggesting that the intense selling pressure of February is easing up.
Also Read: Shiba Inu Price Alert: Technical Bounce Could Hit $0.0195

