
Shiba Inu (SHIB) shows mixed price action, staying stable in the short term. As of April 15, 2026, it trades in a tight range, while weekly performance remains down 2.95%, reflecting ongoing bearish pressure.

According to CoinMarketCap data, the token is trading at $0.000005894. The 24-hour volume is $118.28 million, down 10.07%, while market capitalization holds at $3.47 billion, showing stable momentum overall.
Also Read: Shiba Inu Recovery Requires Break Above $0.00000650 Resistance Zone Level
The Shib chart shows a prolonged bearish trend transitioning into consolidation between $0.0000050 and $0.0000100, with the current price near $0.0000058, forming an ascending triangle that signals accumulation as buyers push toward resistance at $0.0000062
The volume profile indicates strong accumulation between $0.0000055 and $0.0000060, suggesting institutional interest, and a breakout above $0.0000062 could drive price toward $0.0000070 and $0.0000085, offering around 45% upside, while rejection may push it back to $0.0000050
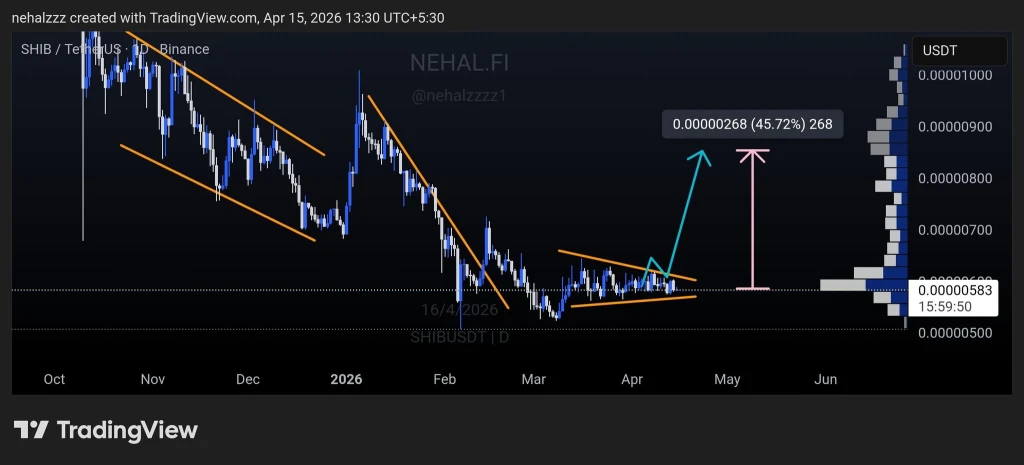
Traders should wait for breakout confirmation above $0.0000062 with volume, target $0.0000070 to $0.0000085, and place stop loss below $0.0000055, as losing $0.0000050 would invalidate the bullish setup in this volatile market, according to crypto analyst Nehal.
From an indicator perspective, the RSI (14) stands at about 49.29, while the RSI moving average stands at about 49.99. These levels indicate that the RSI momentum is in neutral territory.
The asset is neither oversold nor overbought. This suggests indecisiveness in the market, which shows through the price consolidation in the market.

The MACD (12, 26, 9) is hovering around zero, and there is almost no distance between the two lines. Histogram bars have small lengths, which indicates little momentum in the price action, and there seems to be no trend emerging. It indicates a choppy market situation with both bulls and bears on an equal footing.
This article contains market analysis and price predictions. These are not guarantees. Crypto markets are volatile. Always DYOR. Not financial advice.
Also Read: Shiba Inu Holds Key Support as 57B SHIB Outflows Boost Bullish Structure

