
So here we are, another Monday, staring at the charts and asking the same old question: is the market about to wake up, or are we in for another week of sideways grind? The answer, as always, seems to be “both” — because while Bitcoin, Ethereum, and Toncoin have all been moving in their own lanes, the mood tying them together is hesitation. You can feel it in the candles, the indicators, even the news flow. Let’s walk through it.
Bitcoin has been circling in a tight box between $109K and $113K all week, nudging the top a couple of times but never with real conviction. The 4-hour chart shows the 9-period MA lying near-flat, while RSI hovers just above neutral in the low 50s. Basically, this is a market pausing. And that makes sense when you look at the news that’s been tugging it in opposite directions.
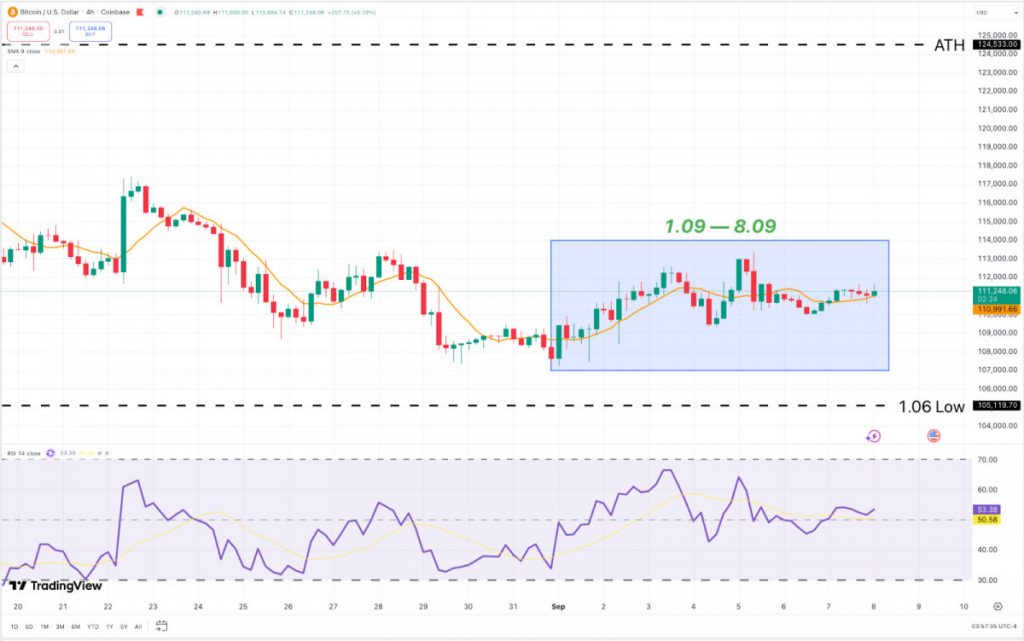
BTC/USD 4H Chart, Coinbase. Source: TradingView
The first shove came from gold. Late August saw the metal rip to new record highs, and that stole some of the “hard asset” glow from Bitcoin right when it could least afford it. The timing was brutal — BTC was already leaning heavy, and suddenly its role as digital gold was being overshadowed by the real thing.

XAU/USD daily price chart. Source: TradingView
Then the whales weighed in. CryptoQuant data showed over 115,000 BTC dumped in August, the largest sell-off since mid-2022. That’s more than $12B worth of supply pressing down on price. If you’ve been wondering why every rally attempt fizzles, there’s your answer.

Bitcoin whales have been offloading. Source: CryptoQuant
Also, mining added its own twist to the whole drama. Difficulty hit another all-time high on Friday, reflecting the long-term security of the network but also reminding traders that miners still need to sell to cover costs. It’s bullish for fundamentals, but in the short run it’s one more source of flow into the market.
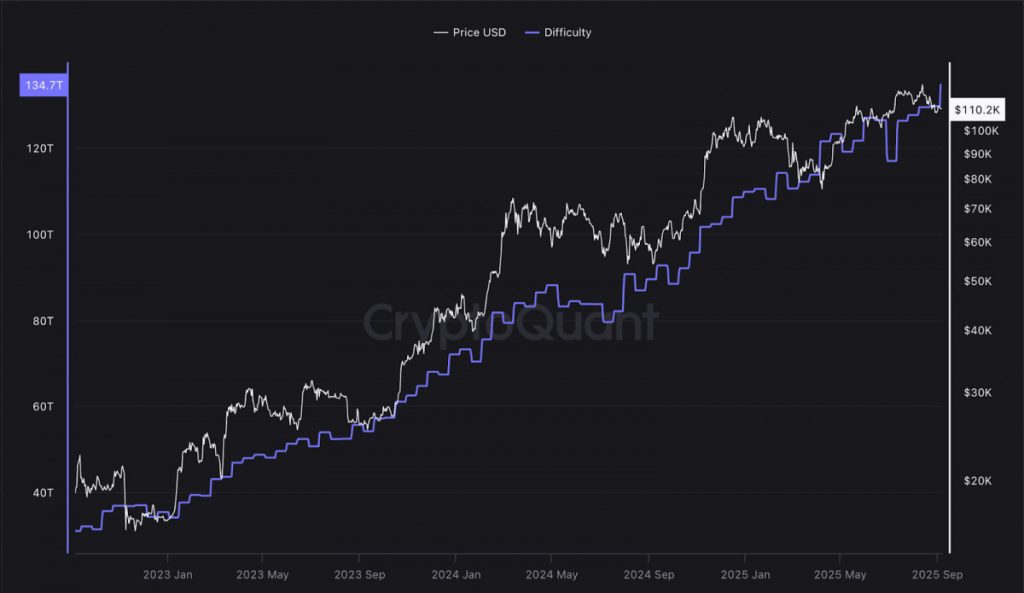
Bitcoin mining difficulty climbs to a new all-time high. Source: CryptoQuant
On the flip side, institutions kept the faith. Spot ETFs saw patches of inflows through the week, reversing some of August’s bleed. Public companies now hold more than 1M BTC — that’s over 5% of total supply locked away on balance sheets.
BREAKING: Total #Bitcoin held by publicly traded companies globally just passed 1,000,000 BTC.
— BitcoinTreasuries.NET (@BTCtreasuries) September 4, 2025
Nearly 5% of all the BTC that will ever bepic.twitter.com/LVGGYbGBfQ
Metaplanet added another 1,000 coins, El Salvador topped up as well, and Tether went out of its way to say it hasn’t been selling a single satoshi, still plowing profits into Bitcoin, gold, and even real estate.
Put all of that together and you’ll get the reasons for the stalemate we’re seeing on the chart. The market is being pulled in both directions at once — heavy supply from whales and miners, steady accumulation from institutions and treasuries. No wonder the candles look confused.
For traders, the levels are these: $113K, once cleared with volume, will open the path opens toward $116K–$118K. But if $109K is lost, we’ll almost certainly retest that $106K low from August. Until then, though BTC is just pacing its cage, waiting for something big enough to break the deadlock.
Believe it or not, Ethereum has also been caught in a narrow $4,250–$4,350 band all week. The 9-period MA has flattened into a straight line, while RSI hangs in the mid-40s, neither hot nor cold. On the surface, ETH looks like it’s just catching its breath after August’s record highs. But as with Bitcoin, the currents underneath are pulling in different directions.

ETH/USD 4H Chart, Coinbase. Source: TradingView
Let’s start with the bearish side. U.S. spot Ether ETFs bled heavily, nearly $800M in outflows over four trading days. That’s real money leaving the asset, and it tells you that at least some of the institutional crowd decided the post-ATH pullback wasn’t worth riding out. It’s hard to build bullish momentum when that kind of weight is pressing down.
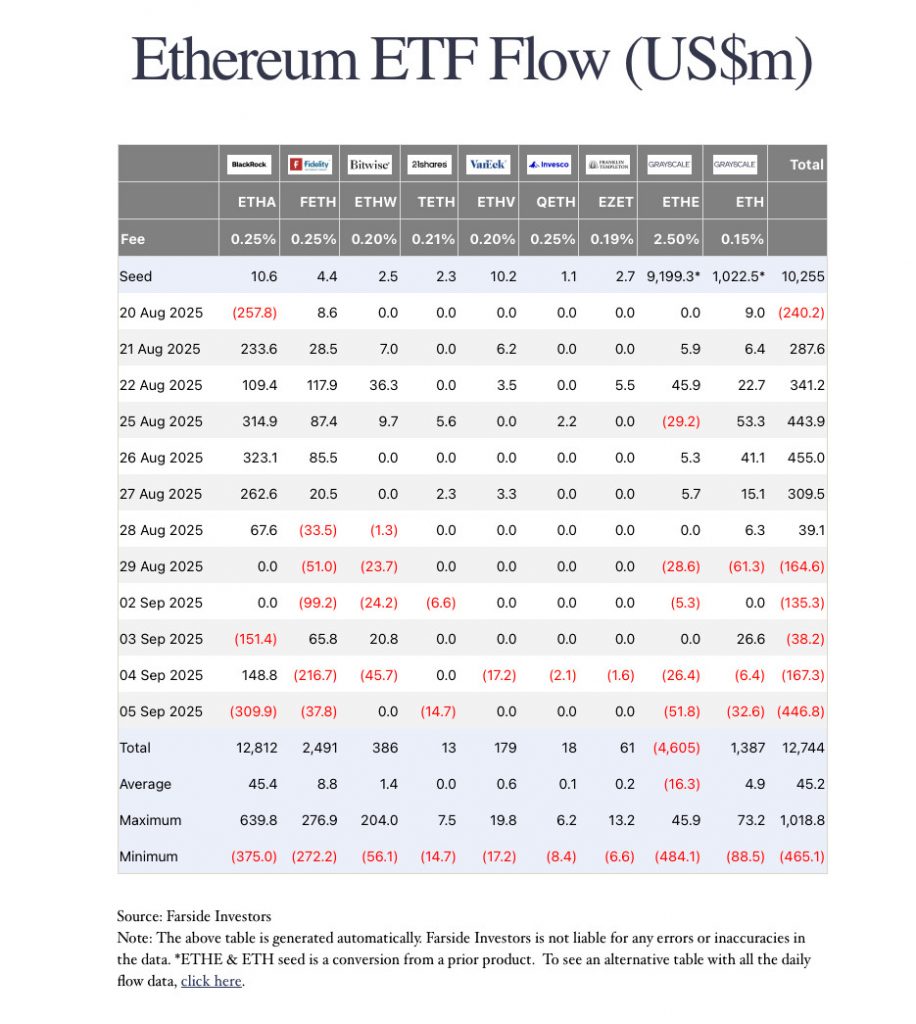
Source: Farside Investors
But on-chain data tells a slightly different story. According to Token Terminal, Ethereum added almost $5B in stablecoins last week alone, pushing total supply to a record $165B. That kind of liquidity usually signals capital parking inside the ecosystem, waiting to move. Exchange balances have kept draining too, hitting multi-year lows. So, supply is tightening, even while ETFs sell.
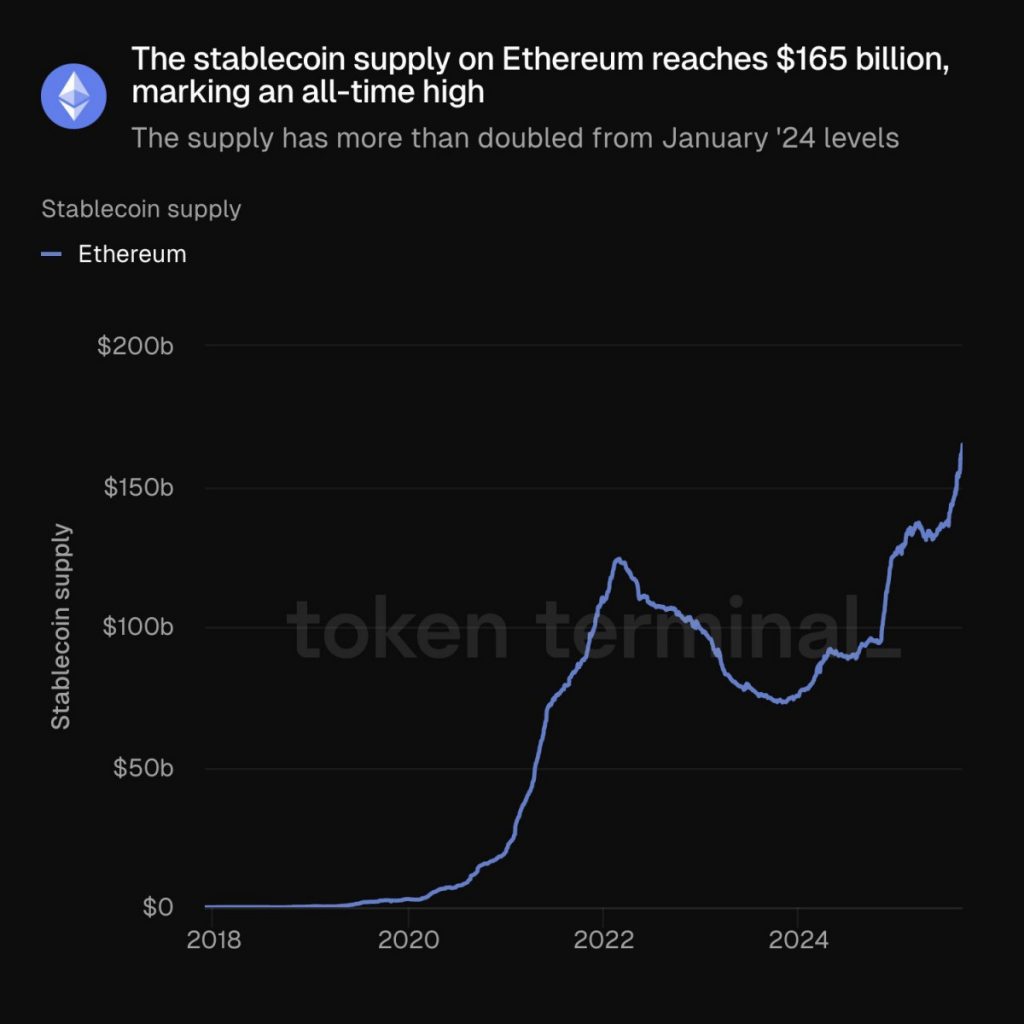
Stablecoin supply on Ethereum surges. Source: Token Terminal
And another piece of the puzzle is, of course, whales. They’ve quietly increased holdings by around 14% since April’s low, and accumulation has continued even during this sideways chop.
— Santiment (@santimentfeed) September 3, 2025
Ethereum has crept back up to nearly $4.5K, with accumulation coming from the key 'millionaire' and 'small billionaire' whales and sharks that hold between 1K and 100K $ETH. In exactly 5 months, they have added 14.0% more coins.
Link to chart: https://t.co/F3qGKbiF65 pic.twitter.com/oK7wdqp685
In our opinion, if $4,200 is held, then ETH can still frame this as healthy consolidation before another leg higher. Reclaiming $4,450–$4,500 with RSI leaning toward 60 would be the makings of a breakout toward $4,700. But if $4,200 gives way, the August low at $4,060 is almost certain to get a retest.
For now, just like Bitcoin, Ethereum is waiting for a trigger.
And then there’s Toncoin, which has been the heaviest of our trio this week. Week after week it’s leaned lower, and now price is balanced right on that mid-June low around $3.05. The price hasn’t cracked it yet, but every test feels heavier. Technically, the chart says indecision with a bearish lean — candles pressing the floor, RSI dangling around 50%, momentum fading, and no bounce with real conviction in sight. But the paradox is that if you only looked at the headlines, you’d swear TON should be flying.
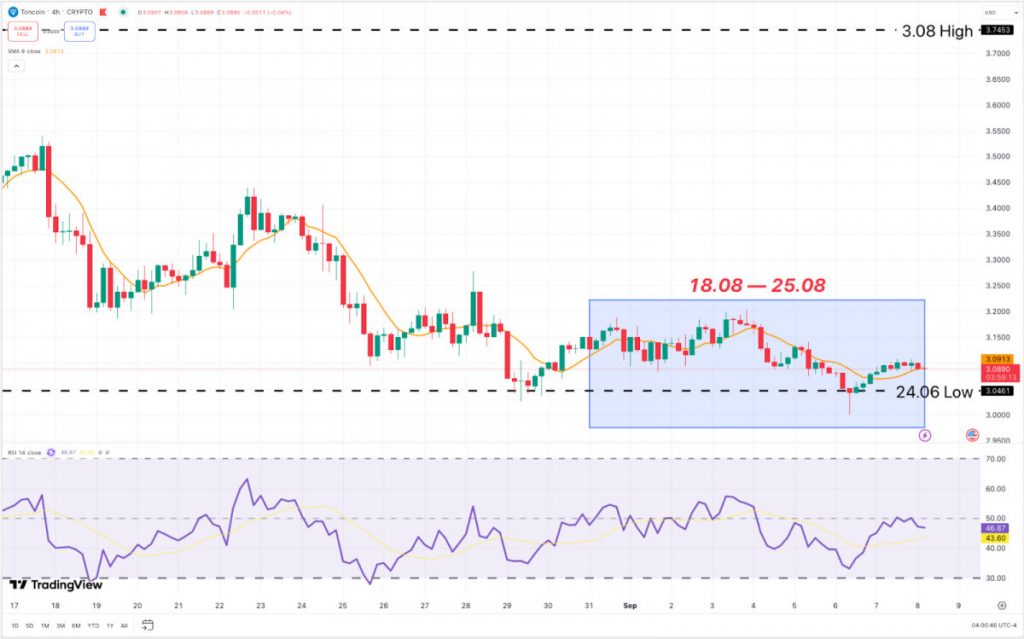
TON/USD 4H Chart. Source: TradingView
As you may remember, last week Robinhood added TON to its lineup, which is a serious stamp of legitimacy for retail exposure.
This past week we also had some heavyweight news: AlphaTON launched a $100M digital asset treasury strategy to buy TON outright. Anthony Scaramucci himself signed on as an advisor. That’s some Wall Street pedigree now favoring TON.
Source: GlobeNewswire
Meanwhile, the official TON account dropped a teaser: one of the world’s “most trusted platforms” is about to join the ecosystem. Speculation has zeroed in on OpenSea, which, if true, would be a significant bridge between TON and the broader NFT market.
Another global name. Another powerful signal.
— TON
This week, one of the world’s most trusted platforms is joining TON.
You won’t want to miss this.#TONeverywhere
(@ton_blockchain) September 7, 2025
So why hasn’t any of this moved price? Probably because the gravity is coming from elsewhere. With Bitcoin stuck in its own range and ETH treading water, TON hasn’t been able to break free. The ecosystem can light fires, but in this market, broader risk sentiment sets the ceiling.
That leaves traders watching one number: $3.05. If it holds, TON has room to rebound toward $3.20–$3.35, especially if the OpenSea rumor materializes. If it cracks, the slide into the high-$2s looks inevitable.
For now, TON is the paradox coin: headlines buzzing, fundamentals deepening, but price is still looking heavy.
The post This Week in Crypto: BTC Pauses, ETH Waits for a Trigger, TON Tests Its $3 Floor appeared first on Metaverse Post.


