The daily SOL/USD chart shows a reversal from the $74 area, which coincides with the 0.382 Fibonacci retracement. From there, Solana reclaimed its 50-day ($77) and 100-day ($76) moving averages, then moved above the 200-day average at $81.
That opened the way to $83 and, ultimately, the psychological $90 level. SOL broke above the $90 resistance and reached $102 before pulling back to around $94. The rejection near $100 shows that sellers are still active above the breakout zone.
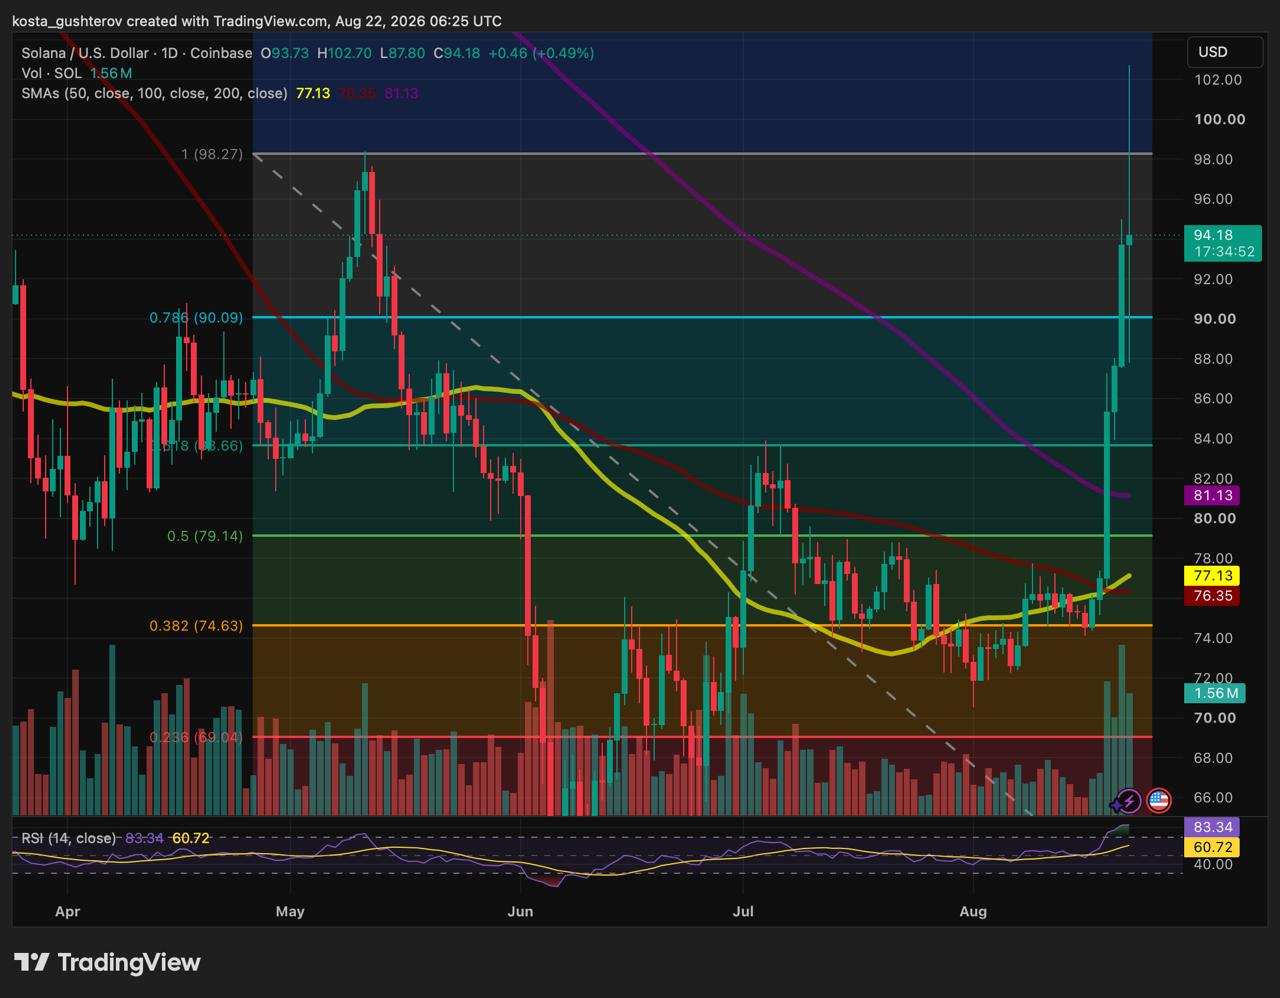
A daily close above $90 would strengthen the breakout case. If SOL falls back below that level, attention shifts to $83, then $79 and the moving-average cluster beneath it.
The daily RSI reached 83, placing SOL firmly in overbought territory. Strong trends can keep the indicator elevated, but the higher it climbs, the greater the risk of abrupt intraday pullbacks.
CoinGlass showed SOL near $94, up 4.28% over 24 hours and 25.3% over the week. Futures volume reached roughly $19.33 billion, while spot turnover was only $1.88 billion.
That is slightly more than $10 in futures trading for every dollar traded on the spot market. Derivatives normally generate larger turnover because of hedging and leverage, but this gap leaves the move more sensitive to liquidations and sudden changes in positioning.
The liquidation data confirms that the rally has not been orderly. Short covering helped accelerate the move higher, while the remaining open interest leaves SOL exposed if late longs begin exiting at the same time.
Funding rates are the next important signal. In perpetual futures, positive funding means longs pay shorts. Modestly positive funding is common during a rally, but rapidly rising funding alongside expanding open interest would point to a crowded long trade and raise the chance of a sharp flush.
Traders can track that balance through CoinGlass’s SOL funding-rate dashboard, alongside open interest and liquidation data.
Solana has cleared its main technical barrier, but the breakout is now entering its harder phase. The $90 area is the line buyers need to defend, while the large futures imbalance leaves little room for complacency if momentum slows.
Methodology: Price structure, Fibonacci levels, moving averages and RSI are taken from the supplied Coinbase SOL/USD daily chart created on August 22, 2026, at 06:25 UTC. Market data is from CoinGlass’s SOL overview, reviewed on August 22; crypto prices, volume, open interest and liquidations change continuously. Funding-rate mechanics are described using CoinGlass’s SOL funding-rate page. The article is provided for informational purposes only and does not constitute investment advice.
The post Solana Crosses $94, but $5.8B Is Still on the Line appeared first on Coindoo.





