
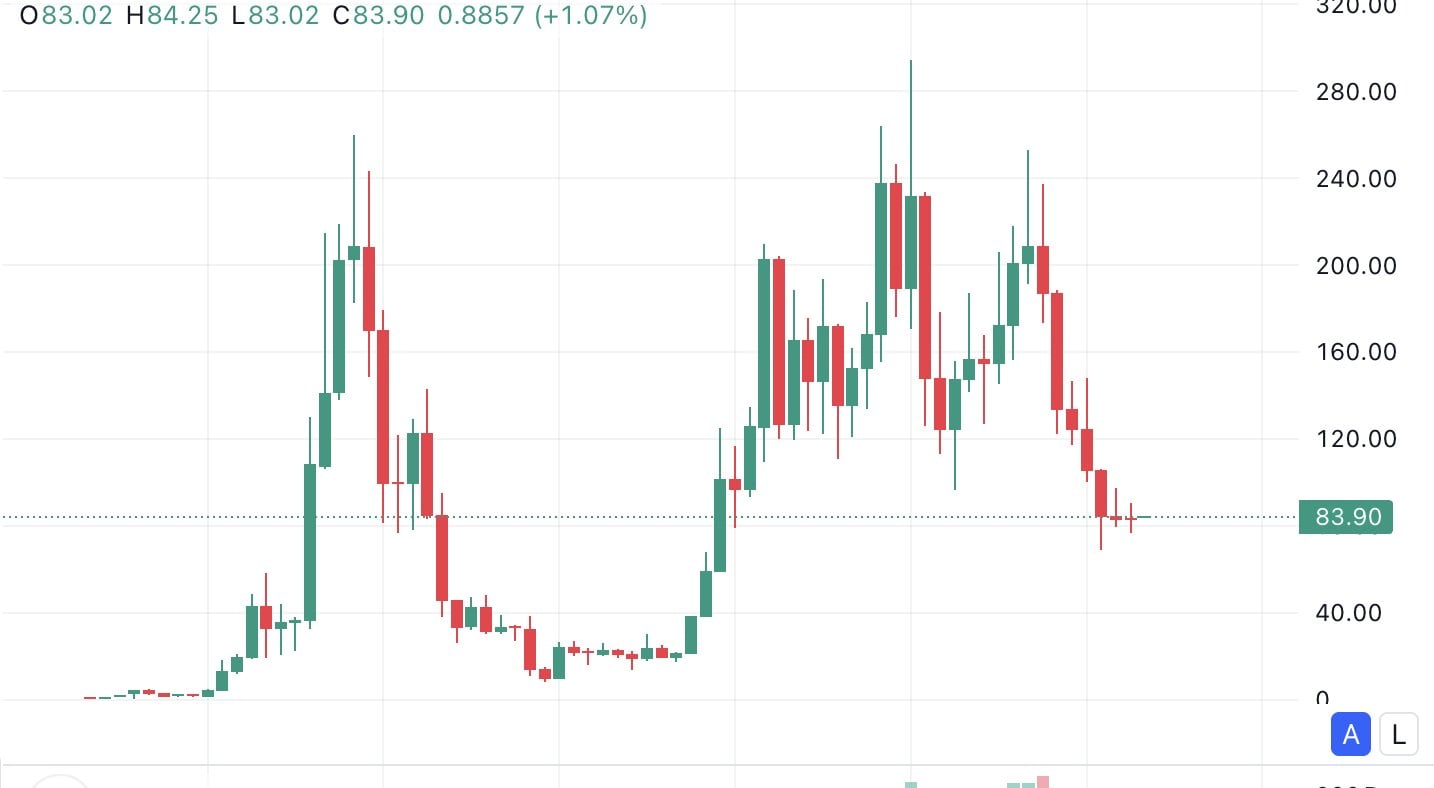
Solana has now spent roughly 87 straight days below $100, turning one of crypto’s strongest former momentum trades into a prolonged test of patience for SOL holders. The token is trading near $84, according to live market data from CoinMarketCap, leaving the $100 level as the first major psychological line bulls need to reclaim.
The pressure is even clearer on the monthly chart. SOL has now printed seven consecutive monthly red candles, its longest monthly losing streak since the asset launched in 2020. The move extends a downtrend that dragged Solana from the $200 region toward the low-$80s, with market trackers highlighting the streak as one of the most severe high-timeframe declines in the token’s history.
That does not make Solana broken, but it does change the burden of proof. Bulls no longer need a small bounce. They need SOL to reclaim the levels that previously acted as support, rebuild volume, and show that buyers can absorb supply above the current range.
SOL slipping below $100 was more than a round-number break. It flipped a major support zone into resistance and forced traders to reassess the strength of the recovery. CoinGecko’s historical price data places SOL near $83 on April 30, with May opening in the same low-$80s area, keeping the token well below the level that defined earlier cycle confidence.
That makes $100 the cleanest upside target on the chart. A return above that level would not instantly erase seven red monthly candles, but it would show that Solana has started to repair its structure. Until then, rallies risk looking like relief bounces inside a larger downtrend.
The current setup also fits the broader Solana price prediction for May, where the market is caught between weak seasonality, fragile technical structure, and still-present institutional demand. SOL has not lost all support, but it has not delivered the kind of breakout needed to change the chart’s tone.
A seven-month losing streak is rare because it reflects more than one bad selloff. It shows persistent distribution across multiple market phases, failed rebounds, and fading confidence after each recovery attempt. That kind of structure can produce two very different outcomes.
The bullish version is a late-stage downtrend where selling pressure starts to weaken and a sharp relief rally begins. That scenario needs smaller red candles, improving volume, stronger spot demand, and a clean reclaim of key resistance. If SOL can push back above the mid-$80s, then $90 to $100 becomes the next zone where bulls can prove the streak is losing force.
The bearish version is a continuation pattern. If sellers keep control and SOL fails to hold the current low-$80s range, the next move could test the lower supports that traders have been watching since the February crash. Recent price action has already left SOL inside a tight no-trade zone, where chasing weak candles can leave traders exposed to sudden reversals in either direction.
Solana’s price action is ugly, but the network debate is more complicated. The chain still has one of the most active ecosystems in crypto, with major traction across decentralized exchanges, meme coins, consumer apps, stablecoin flows, and high-throughput trading activity.
That disconnect is why the market has not fully abandoned SOL. The asset’s chart is weak, yet the network remains heavily watched because Solana still offers fast settlement, low fees, and deep developer attention. Traders are trying to decide whether the current slump is a prolonged reset after an overheated cycle or a warning that capital is rotating away from the ecosystem.
Institutional flows add another layer. Solana ETF and fund-related demand has been inconsistent, and weaker inflows can make it harder for SOL to break out while spot buyers remain cautious. When institutional demand fades and exchange selling rises, even strong ecosystem narratives can struggle to lift price.
The next Solana recovery attempt needs structure, not noise. A move back through $86 and $90 would improve the short-term chart, but the bigger test remains $100. That level now carries psychological, technical, and sentiment weight after nearly three months below it.
If SOL reclaims $100 with rising volume, the seven-month red streak may start to look like exhaustion rather than collapse. If price keeps rejecting below that level, the market may treat each bounce as another chance for sellers to defend the downtrend.
Solana still has the network activity and brand power to recover, but the chart is demanding proof. Seven monthly red candles have turned $100 into more than a price target. It is now the level that decides whether SOL’s long bleed starts to heal or becomes the next major altcoin warning.
The post Solana’s Brutal $100 Curse Deepens As SOL Prints Its Longest Red Streak Ever appeared first on Crypto Adventure.

