
Solana just dropped below $170, and while that might worry some people, others think it could be a setup for a strong comeback. Market watchers are now watching closely, as signs like rising on-chain activity and a possible ETF are starting to build some excitement again.
Solana has come under pressure once again, with the price dropping below the $170 mark after trading above $200 just two weeks ago. This latest pullback marks a nearly 18% decline, and it’s happening with noticeable volumes. The chart posted by Mario Nawfal shows a steep drop-off as August begins, raising the question of whether there is going to be a continuation.
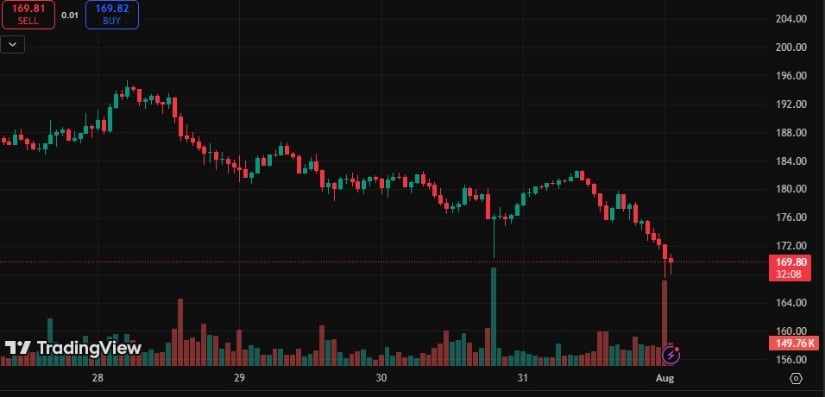
Solana sees a sharp drop in two weeks as the price slips below $170, putting key support back in focus. Source: Mario Nawfal via X
From a technical lens, $168 to $165 has acted as a reactive support zone in the past, and that range is now back in focus. If Solana can stabilize here, it could present a short-term opportunity for dip buyers. But if sellers break below that structure, eyes could shift to the $150 to $155 zone as the next major level to watch.
Following Solana’s swift fall below $170, chartist Ali points to a potential reversal sign, this time from the Tom DeMark Sequential indicator. The tool, popular for spotting exhaustion points in trends, just triggered a buy setup on the 4H chart. While SOL is still hovering near its short-term lows, this signal suggests that bearish momentum may be cooling off, with conditions ripe for a local bounce if buyers step in.
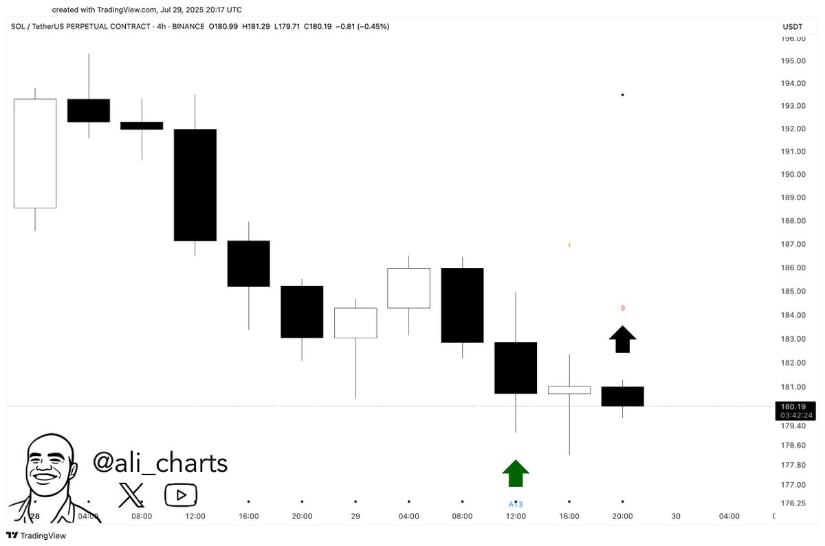
Tom DeMark Sequential flashes a buy signal on Solana’s 4H chart, hinting at a possible short-term bounce. Source: Ali via X
The indicator aligns with the support zone flagged earlier between $168 and $165. If SOL respects this level over the next few sessions, short-term traders may eye a mean-reversion bounce towards the $180 to $185 range.
Even as Solana dips below $170, the ETF narrative is heating back up once again. A newly surfaced Form S-1 Amendment filed by VanEck for a “Solana ETF” is now making the rounds, adding a fresh layer of long-term optimism despite near-term volatility. The filing itself doesn’t mean approval is guaranteed, but it does show serious intent.
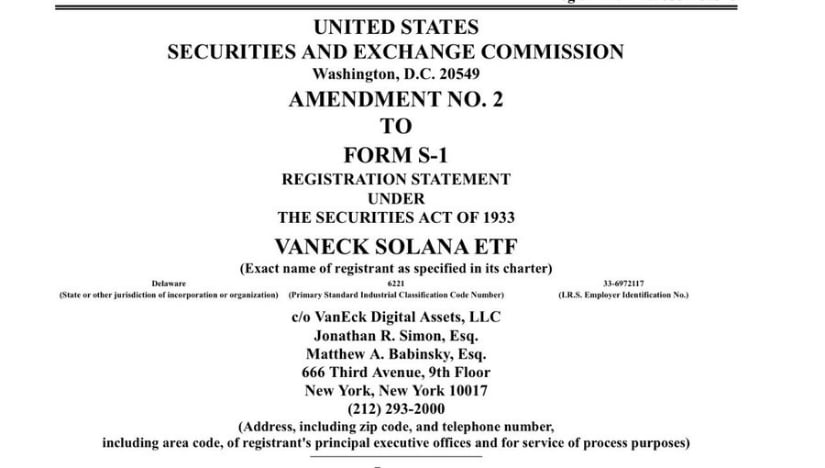
VanEck’s updated Solana ETF filing stirs long-term optimism amid SOL’s short-term price dip. Source: Jesse Peralta via X
This development follows closely on the heels of the Tom DeMark buy signal and a key technical support retest. Together, the dip and the ETF buzz paint a mixed but intriguing picture. Some remain cautious in the short term, while investors looking ahead might see this as a build-up phase.
Analyst Waleed Ahmed’s latest chart brings a fresh perspective to Solana’s price action, highlighting a well-defined bullish harmonic pattern. The ABCD structure suggests that SOL may be completing a full retracement leg, with key Fibonacci confluences aligning between $162 and $165. This zone has already been mentioned in earlier support discussions, and now, it overlaps with the harmonic “PRZ” (Potential Reversal Zone), which could offer some technical backbone for a bounce.
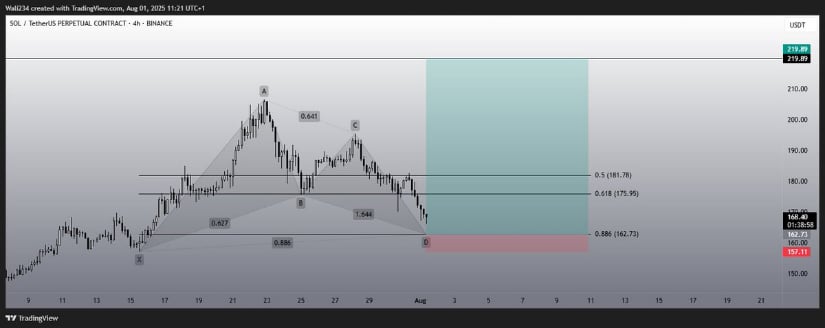
Bullish harmonic pattern points to $220 target if Solana holds the key $162 to $165 reversal zone. Source: Waleed Ahmed via X
A successful hold of the $162 to $165 region sets up potential upside toward $180, $195, and possibly even back to the $210+ range, depending on how broader market conditions evolve. With ETF optimism building and Tom DeMark signals already flashing green, this harmonic setup could act as the technical trigger for a much-needed recovery.
While Solana’s price has been under pressure, on-chain data has remained strong. According to the latest figures shared by SolanaFloor, Solana DEX volume surged to nearly $30 billion for the week ending July 27, its highest level in over eight weeks.
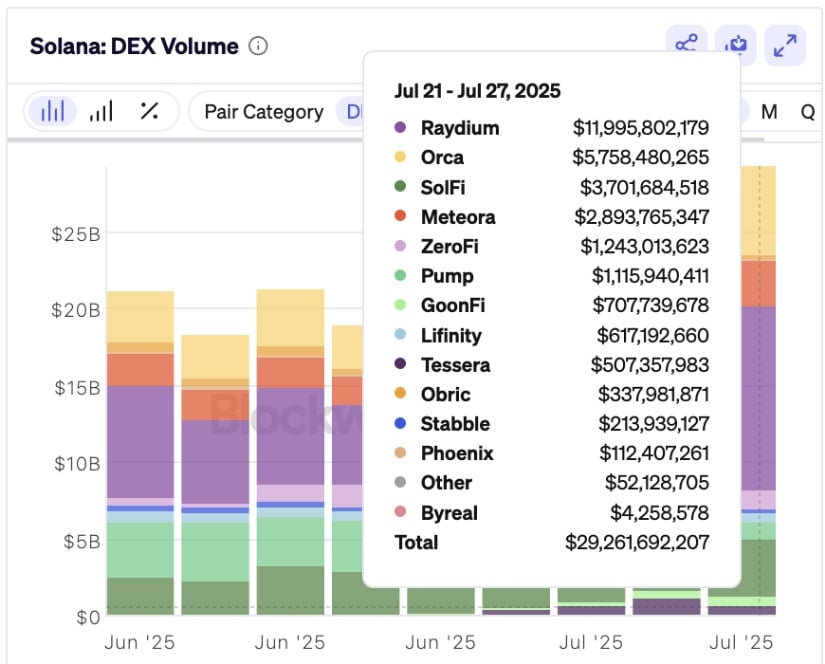
Solana DEX volume hits $30B in a week, marking its highest in over two months despite price pullback. Source: SolanaFloor via X
This growing on-chain activity lends further credibility to the emerging bullish Solana price prediction.
Solana’s recent dip below $170 may feel like weakness, but the technical and on-chain signals are painting a more reasonable picture. With the Tom DeMark Sequential flashing a buy, a key harmonic pattern forming near $165, and ETF speculation back in the headlines, the current zone could be more of a springboard than a breakdown. Short-term uncertainty remains, but buyers seem to be circling this region.
At the same time, the surge in DEX volume shows that real user activity hasn’t vanished; it’s growing. That divergence between price and on-chain traction could be exactly what fuels the next leg higher.

