
Solana (SOL) extended its decline on April 2, 2026, confirming a bearish technical breakdown that has increased selling pressure across the broader crypto and altcoin markets. The failure to bounce back from a key support level that has turned into resistance has further reinforced the bearish trend.
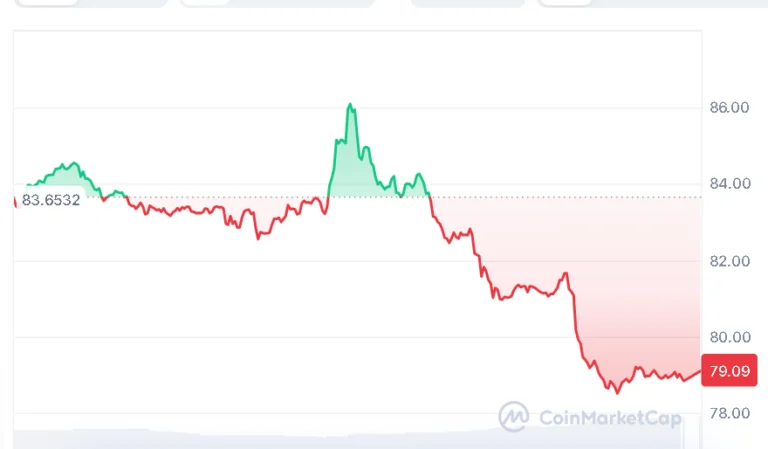
At the time of writing, SOL is trading at $79.09, with a 24-hour trading volume of $9.02 billion and a market capitalization of $45.18 billion, according to data from CoinMarketCap. The SOL has declined by 5.42% over the past day, adding to concerns about continued downside pressure, as Bitcoin and Ethereum also show signs of consolidation.
Also Read | Tron Inc. Expands Treasury to 689 Million Tokens, TRX Eyes $0.48 Target
On April 2, 2026, crypto analyst Alpha Crypto Signal stated that the breakdown in the identified ascending channel for SOL had played out as expected. This is based on the analysis provided, which shows that SOL attempted to make a comeback but was rejected at the support of the broken channel.
This rejection has seen SOL lose nearly 9.88% as a result of failing to go back above the identified support.
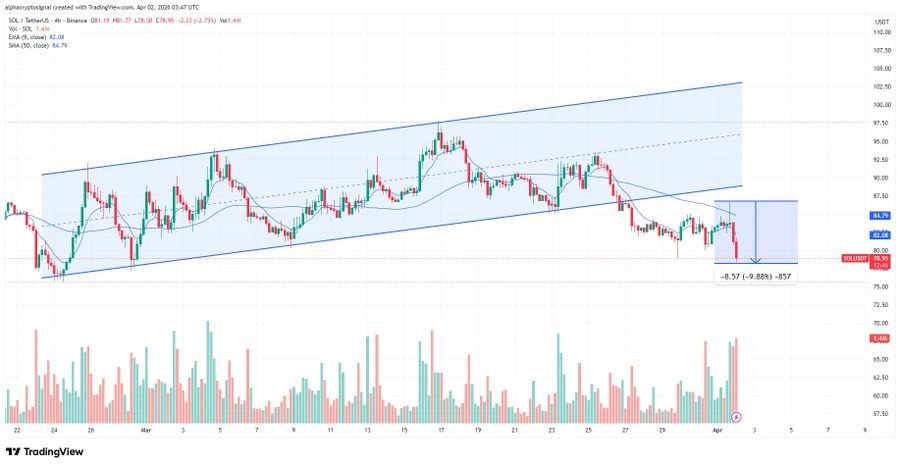
The analyst further explained that the market structure remains negative as long as the price of SOL is below this key level, which is currently acting as resistance. This breakdown has increased the probability of further downside, with investors watching key support zones and sentiment in the crypto markets.
From a technical perspective, the indicators remain a reflection of the weakness. Currently, the Relative Strength Index (RSI) remains at 31.31, which is below the neutral 50 mark and continues to move towards the oversold zone. This reflects a lack of buying power. Additionally, the signal line remains close to 33.90.
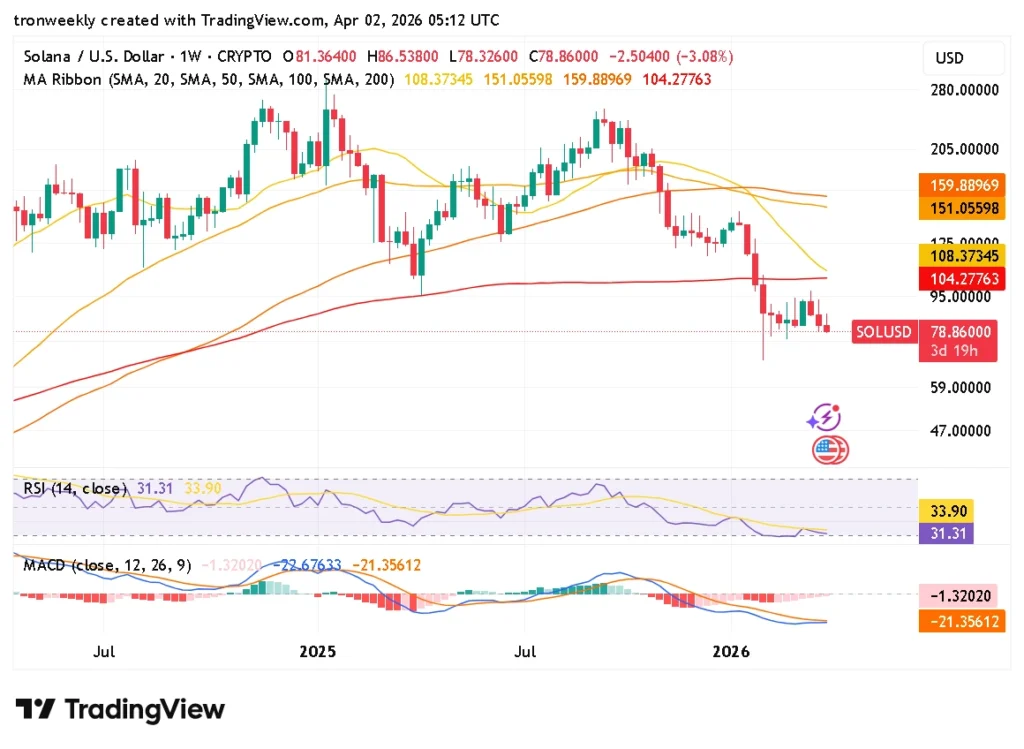
Moving averages indicate the level of price pressure. The current price of SOL is below the key levels of the 20-day MA at $108.37. The levels of the 50-day MA and the 100-day MA are at $151.05 and $159.88. These levels may limit the upside in the altcoins.
The bearish view is also supported by the MACD indicator, as its line is currently at -21.35, which is below the signal line at -1.32, and the histogram has negative values.
Overall, the general trend remains bearish for Solana. All technical indicators and the general trend in the crypto market point to the continued decline in the asset’s price unless it breaks past the key resistance levels. The above analysis is purely technical and not financial advice.
Also Read | ASTER Price Technical Setup Points Toward $1.40 Target Level

