
Solana (SOL) has overtaken Ethereum in all-time unique developers, now leading all blockchain ecosystems. As of March 28, 2026, this milestone highlights Solana’s rapid growth, strong developer appeal, and increasing adoption as builders shift toward its high-performance network.
The shift signals growing momentum for Solana, reflecting rising confidence in its scalability and speed. As more developers join its ecosystem, it could reshape competition, challenge Ethereum’s dominance, and influence the future direction of blockchain innovation.
Also Read: Solana (SOL) Hits 44% Transactions but Price Struggles
According to the crypto analyst More Crypto Online, Solana’s 1-hour chart shows a decisive shift from an uptrend into a corrective bearish trend after breaking a rising trendline.
The token is trading at $83, indicating a loss of structure, while the wave patterns indicate a downtrend rather than a reversal. The chart indicates a significant resistance range from $85 to $88, established by Fibonacci retracement levels.
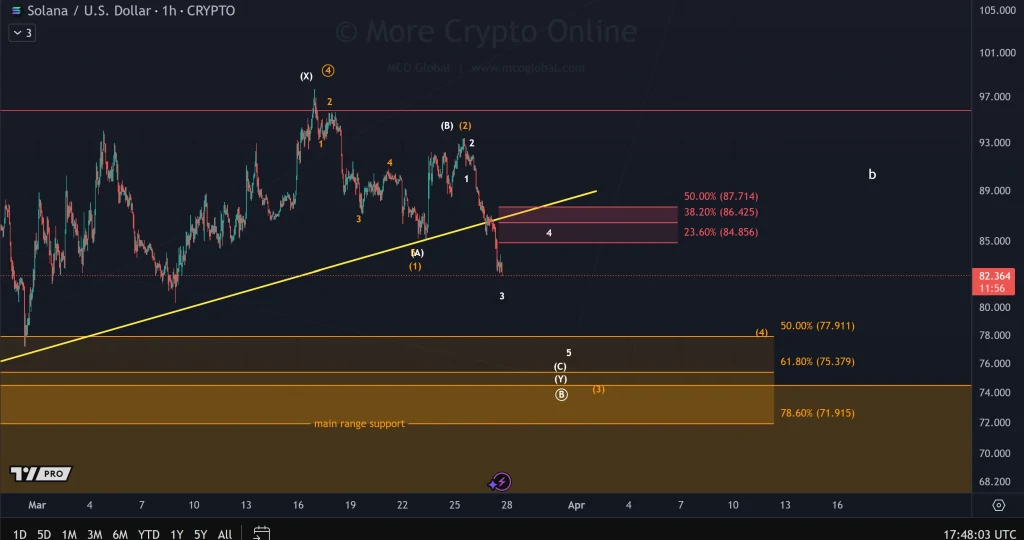
An advance into this region will most certainly be met with rejection, consistent with a bearish wave count. It appears that the selling pressure is currently dominant, unless a significant advance into the $90 region is made.
On the downside, the important support level is located between $78 and $72, where several important Fibonacci levels line up.
This area could be the potential bottom for this current move. Until then, the bias on the chart will be to the downside, reaching these targets.
From an indicator perspective, the RSI (Relative Strength Index) is represented by a purple line at 34.33 and a yellow line at 36.17.
The RSI has been trending lower below 50, which indicates a lack of momentum. In recent times, it has been trending towards 30.

The MACD chart indicates that the blue MACD line is at -1.87767, the orange signal line is at -1.34288, and the histogram is at -0.53479.
Since the MACD line is below the signal line, momentum is bearish. Although the bars on the histogram are still below zero, they are getting shorter, suggesting a possible change in trend.
The increasing popularity of Solana among developers indicates a long-term change in the blockchain landscape and how the competition is now closing in on Ethereum.
The decline in the price of the token indicates the short-term, volatile nature of the cryptocurrency market.
This article contains market analysis and price predictions. These are not guarantees. Crypto markets are volatile. Always DYOR. Not financial advice.
Also Read: Solana Breach Below $82 Could Trigger Extended Market Correction

