Solana (SOL) is currently above a significant level of technical support, as analysts observed that the price structure of the asset remains unchanged despite the prevailing market pressure. Analysts observed that the price of SOL may move in the direction that it can hold up in the range of $86 to $91.
At the time of writing, Solana (SOL) is trading at $88.20, with a 24-hour trading volume of $8.89 billion and a market capitalization of $50.74 billion, according to CoinMarketCap. The price has declined by 3.57% over the last 24 hours.
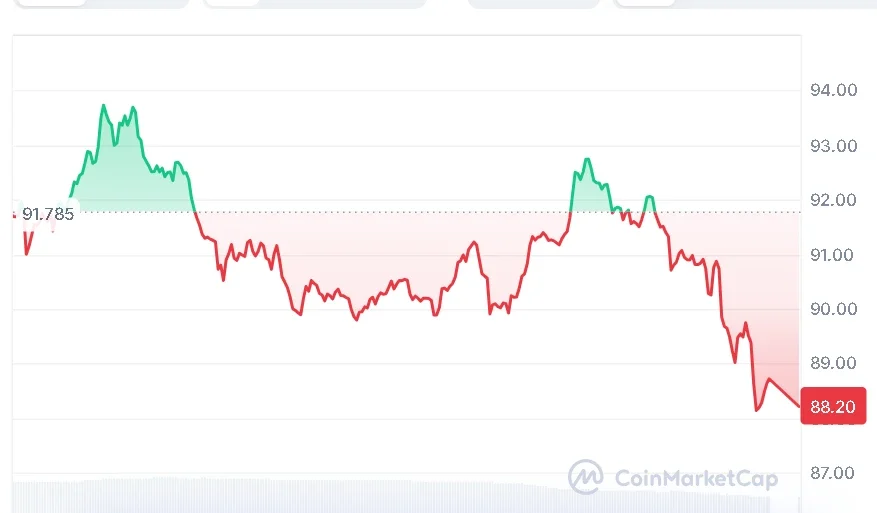
Source: CoinMarketCap
As reported by a crypto analyst, More Crypto Online, the total structure on the price chart of Solana had remained unchanged since the previous day. The price continues to rise, as noted on the chart.
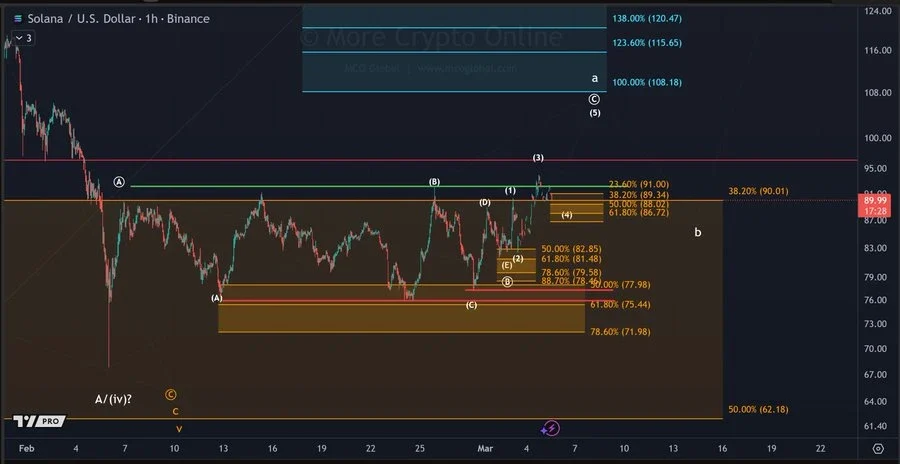
Source: X
The important micro support level between $86.70 and $91.00 still holds true. It has been observed that if the price of SOL stays within the said range or above it, then it is expected that the existing trend will continue. However, if the price crosses the said level, it may again be subject to pressure.
The current technical indicators for the Solana price movements in the future are mixed. The Relative Strength Index (RSI) for Solana is 49.89, which is close to the neutral zone, and the signal line for Solana is 42.28, indicating increasing buying pressure.
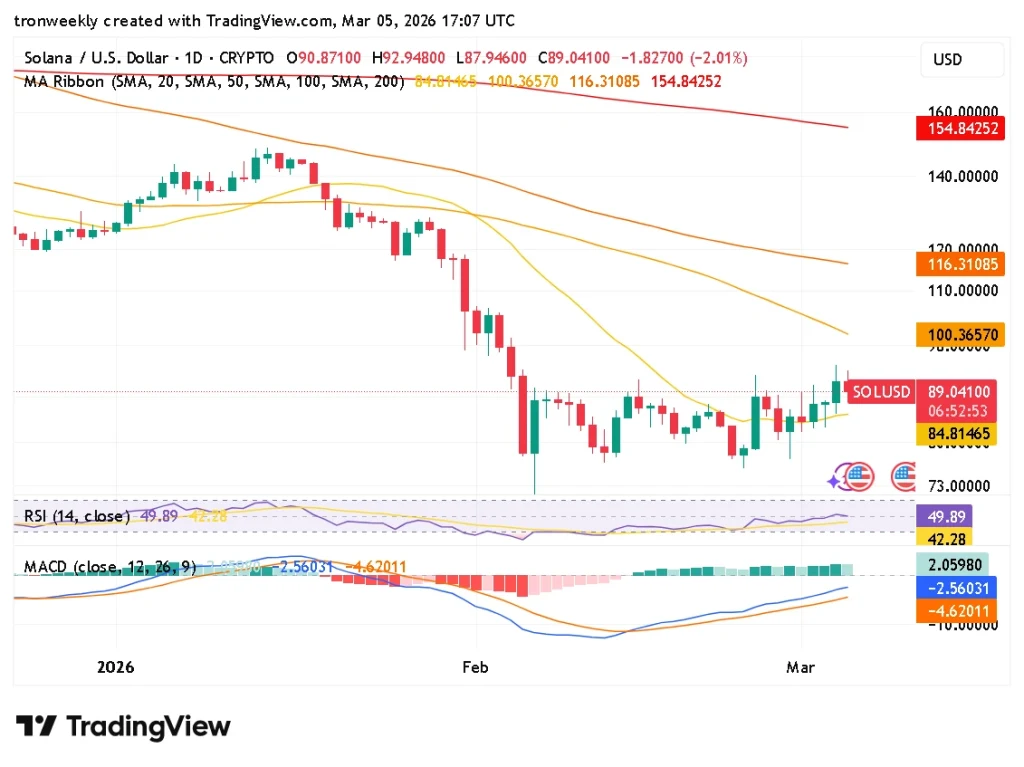
Source: TradingView
Solana is trading slightly above its 20-day moving average, which is $84.81, and hence has some support, although it is still below its 50-day moving average, its 100-day moving average, and its 200-day moving average, all of which are $100.36, $116.31, and $154.84, respectively, and hence reflect a bearish market.
Also Read | Tron Inc. Expands Holdings With Fresh $50K Purchase of 175K TRX
The MACD indicator seems to suggest a cautious sentiment in the market. The MACD line is at -2.56, with the signal line also in negative territory at -4.62. However, the histogram is at 2.05, which is positive in the chart.
If the wave of change keeps rolling, it could lead to a revival in Solana’s price. Analysts have indicated that for the revival to happen, the price change has to be significant.
Also Read | Litecoin (LTC) Eyes $75 Target as Binance Launches New LTC/U Pair

