Solana started a fresh increase above the $212 zone. SOL price is now consolidating above $210 and might aim for more gains above the $218 zone.
Solana price started a decent increase after it found support near the $200 zone, beating Bitcoin and Ethereum. SOL climbed above the $205 level to enter a short-term positive zone.
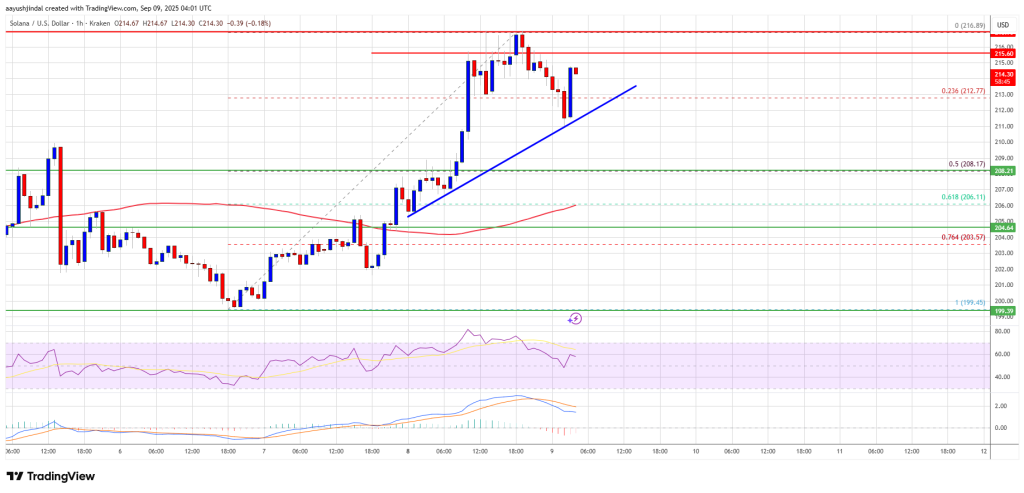
The price even smashed the $212 resistance. The bulls were able to push the price above the $215 barrier. A high was formed at $218 and the price is consolidating gains. There was a minor drop below the 23.6% Fib retracement level of the upward move from the $199 swing low to the $217 high.
Solana is now trading above $210 and the 100-hourly simple moving average. There is also a bullish trend line forming with support at $212 on the hourly chart of the SOL/USD pair.
On the upside, the price is facing resistance near the $218 level. The next major resistance is near the $220 level. The main resistance could be $232. A successful close above the $232 resistance zone could set the pace for another steady increase. The next key resistance is $244. Any more gains might send the price toward the $250 level.
If SOL fails to rise above the $218 resistance, it could start another decline. Initial support on the downside is near the $212 zone. The first major support is near the $208 level or the 50% Fib retracement level of the upward move from the $199 swing low to the $217 high.
A break below the $208 level might send the price toward the $204 support zone. If there is a close below the $204 support, the price could decline toward the $200 support in the near term.
Technical Indicators
Hourly MACD – The MACD for SOL/USD is gaining pace in the bullish zone.
Hourly Hours RSI (Relative Strength Index) – The RSI for SOL/USD is above the 50 level.
Major Support Levels – $212 and $208.
Major Resistance Levels – $218 and $220.


