Solana started a fresh increase from the $194 zone. SOL price is now recovering higher and faces a heavy resistance near $212.
Solana price started a decent increase from the $194-$195 zone, like Bitcoin and Ethereum. SOL was able to climb above the $200 and $202 resistance levels.
There was a clear move above the 50% Fib retracement level of the downward move from the $218 swing high to the $194 low. However, the bears seem to be active near the $212 resistance zone. The price reacted to the downside below $210.
There was a break below a connecting bullish trend line with support at $207 on the hourly chart of the SOL/USD pair. Solana is now trading above $204 and the 100-hourly simple moving average.
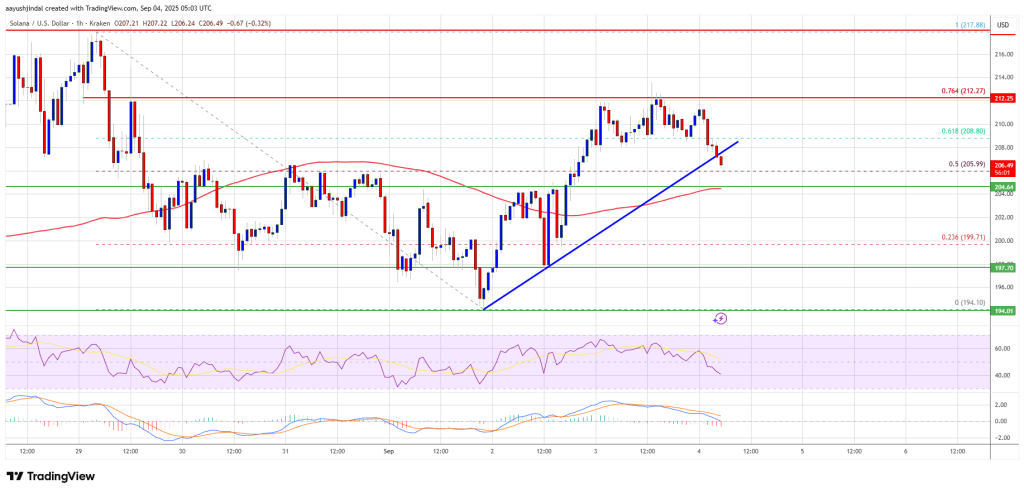
On the upside, the price is facing resistance near the $2102 level. The next major resistance is near the $212 level or the 76.4% Fib retracement level of the downward move from the $218 swing high to the $194 low. The main resistance could be $218. A successful close above the $218 resistance zone could set the pace for another steady increase. The next key resistance is $232. Any more gains might send the price toward the $245 level.
If SOL fails to rise above the $212 resistance, it could continue to move down. Initial support on the downside is near the $204 zone. The first major support is near the $200 level.
A break below the $200 level might send the price toward the $195 support zone. If there is a close below the $195 support, the price could decline toward the $184 support in the near term.
Technical Indicators
Hourly MACD – The MACD for SOL/USD is losing pace in the bullish zone.
Hourly Hours RSI (Relative Strength Index) – The RSI for SOL/USD is below the 50 level.
Major Support Levels – $200 and $195.
Major Resistance Levels – $212 and $218.

