
Solana continues to move within a tight range this week, with its price sitting near $187.76 after a mild 1.98% gain. The weekly chart shows a steady rhythm, fluctuating between $177.14 and $197.71.
The candles have narrowed, signaling reduced volatility but not a breakdown. The market is currently positioned around the middle Bollinger band at roughly $188, often seen as a fair-value pivot.
The broader structure reflects a multi-month consolidation phase, suggesting the market is undecided. The Fibonacci retracement levels outline clear zones of resistance above $200 and strong support around $160 and $130.
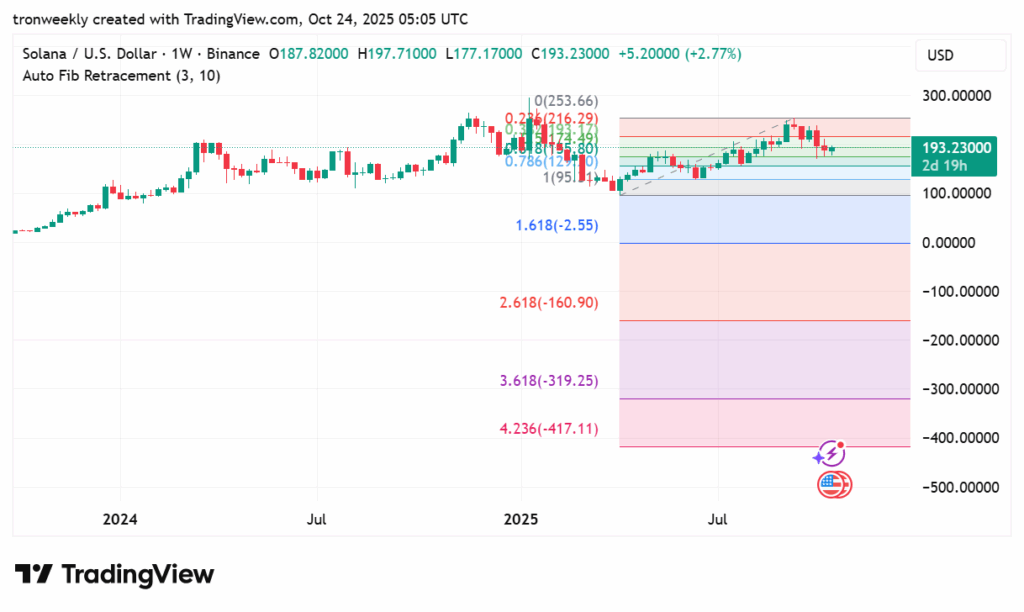
While Solana has struggled to reclaim the $200 mark, the price remains stable, showing no sign of panic selling. The overall setup points toward a neutral-to-bullish bias, with upside potential if fresh momentum appears.
Also Read: Solana Faces Pivotal Support Test: Is a Price Reversal Imminent?
Momentum indicators reveal a short pause in Solana’s recent strength. The MACD sits just below its signal line, near 10.75 and 11.46, respectively, hinting at a mild bearish divergence.
This suggests a temporary slowdown rather than a reversal. A bullish crossover in the coming weeks would confirm renewed momentum, possibly attracting fresh buying interest.
The Chaikin Oscillator, hovering around 87.6k, paints a different picture; it remains positive, reflecting ongoing inflows and steady accumulation.
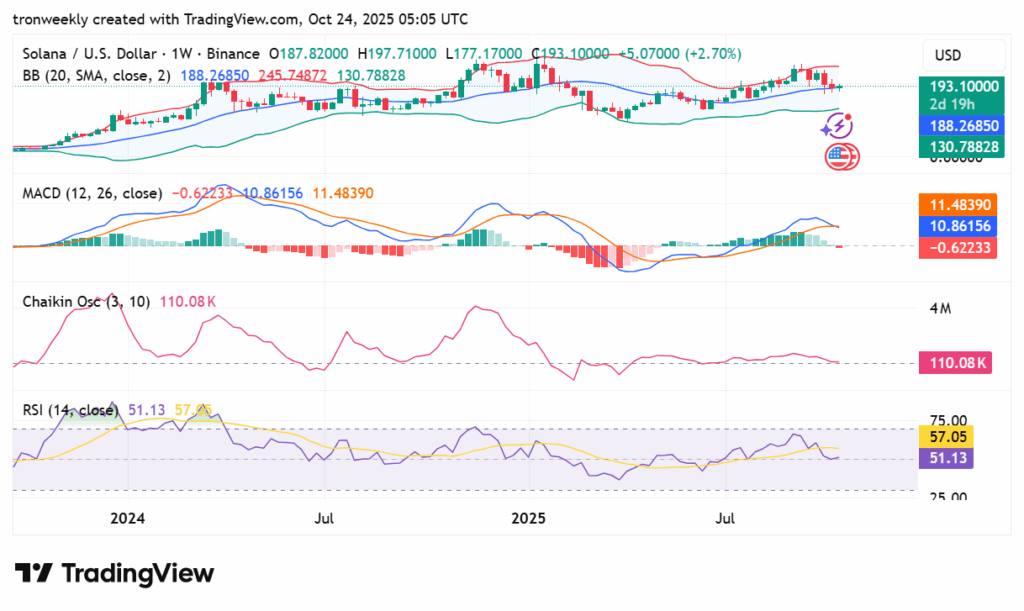
This means larger investors continue to buy during dips, supporting price stability even as short-term traders take profits.
Meanwhile, the RSI rests at about 50.8, signaling a balanced market. It’s neither overbought nor oversold, giving Solana the flexibility to move quickly once direction becomes clear.
A move above 60 on the RSI could hint at a stronger bullish run, while a drop below 45 might indicate an early correction.
For October 2025, the base scenario, holding roughly a 55% probability, sees Solana trading between $175 and $200. This range suggests ongoing consolidation while momentum indicators slowly rebuild.
A close above $200 could lift prices toward $215 or even $230 in the coming weeks. The bullish scenario, carrying about 30% probability, envisions a push beyond $245 if momentum aligns with rising RSI readings.
However, if Solana loses footing below $180 and capital inflows fade, a slide toward $160 or $130 could emerge, marking the start of a deeper correction.
Also Read: Solana Price Eyes $400 Rally After Hitting 5-Year Trendline Support


