Spend enough time on a chart and the price action begins to confirm what you decided before you opened it.
The setup didn’t change. The candles printed where they were always going to print. But somewhere between the first glance and the third hour, the chart started agreeing with you. The line you drew at 9 a.m. looks different at noon. The structure you were unsure about now seems obvious. The trade you weren’t going to take is suddenly the trade you’re about to enter.
Nothing about the market shifted. Only the reader shifted.
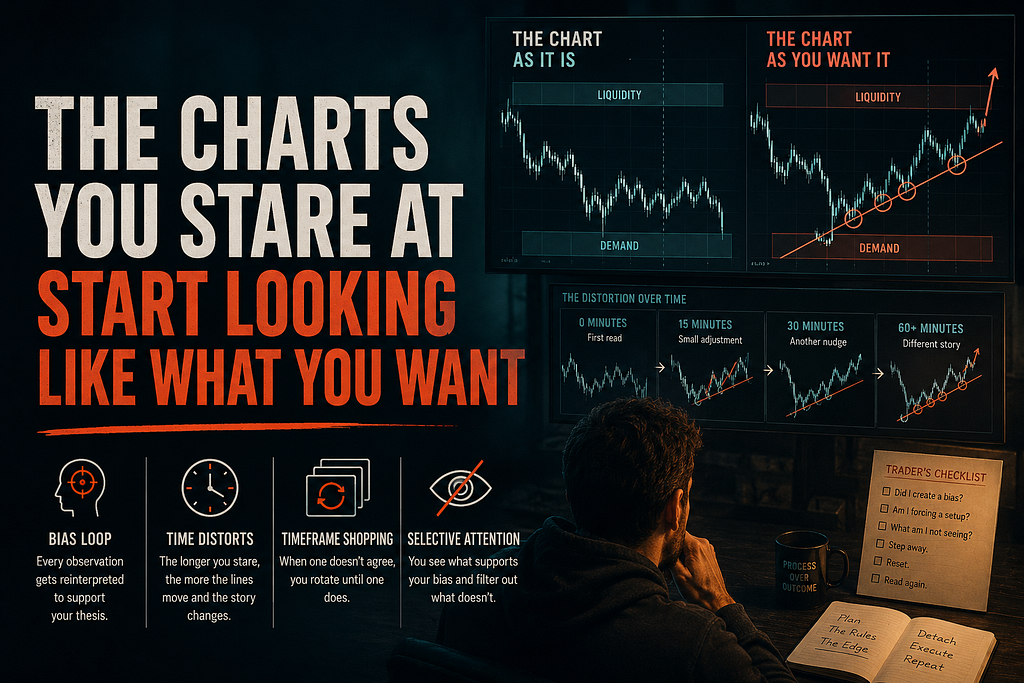
The first time you open a chart, you see it as it is. The trend is whatever the trend is. The levels are wherever they are. You haven’t committed to anything yet, so there’s nothing to defend.
That clarity has a short shelf life.
Within minutes of looking at price, the brain starts building a story. A direction. A bias. A preferred outcome. Once that story exists, every subsequent glance at the chart is no longer observation. It’s verification. You’re not reading the market anymore. You’re checking whether the market agrees with the version of it you constructed.
The first read is the honest one because it’s the only one untouched by a desired outcome.
Trend lines are supposed to be objective. Two points connected by a straight edge. There’s no ambiguity about where a line goes once you’ve chosen the touches.
But the touches change.
After fifteen minutes of staring, a wick that was clearly an overshoot becomes the new pivot. The line gets nudged up. After thirty minutes, a candle close that didn’t matter starts to matter. The line shifts again. By the time you’ve stared for an hour, the trend line connects different points than it did when you drew it. The chart looks the same. The line on the chart does not.
You didn’t lie to yourself. You adjusted. Each adjustment was small enough to feel reasonable. Stacked together, they describe a different market than the one you were originally looking at.
This is the mechanism: small, defensible micro-adjustments that aggregate into a wholly different reading. No single move feels wrong. The endpoint is wrong anyway.
There are five common timeframes most traders cycle through. The fifteen-minute, the one-hour, the four-hour, the daily, the weekly. Each one tells a slightly different story about the same asset.
When the timeframe you started on doesn’t support the trade you want, you rotate. The one-hour looks weak, but the four-hour looks fine. The four-hour looks weak, but the daily looks supportive. The daily looks supportive enough that you stop checking the hour.
You stopped on the timeframe that agreed with you.
This is not analysis. This is selection. Across enough timeframes, at least one will offer a chart that fits the thesis. Finding that timeframe doesn’t make the thesis correct. It only confirms that the trader was willing to keep looking until something matched.
The market doesn’t care which chart you ended on. The trade still has to work in real time, where all timeframes exist simultaneously and none of them is the “right” one.
Once a thesis exists, every observation gets sorted into one of two piles: evidence for, and evidence to dismiss.
Volume increases. Evidence for. Volume drops. Healthy consolidation. A red candle prints. Stop hunt. A green candle prints. Confirmation. Price stalls. Accumulation. Price drops. Liquidity grab.
There is no observation the chart can produce that cannot be reframed as supportive of the trade you already want. The bias loop is closed. Every input has a pre-assigned interpretation. No new information can change the conclusion because no information is being received as new.
This is why humility is the actual edge most traders never develop. Stepping away from the chart breaks the loop. The next time the chart is opened, the bias has cooled. The micro-adjustments to the trend line look strange. The timeframe that “confirmed” the trade looks less convincing. The story the brain built starts to come apart, because the brain isn’t holding it together anymore.
The edge isn’t in better pattern recognition. The edge is in interrupting your own pattern recognition long enough to see the chart again.
Attention is a filter. Whatever the brain is primed to look for, it finds. Whatever it isn’t primed to look for, it does not register, even if the data is right there on the screen.
A trader looking for a breakout sees pressure against the level. They see consolidation tightening. They see the buildup of momentum. What they do not see, often, is the higher timeframe trend pointing the other way. They do not see the divergence on the relative strength reading. They do not see the volume profile suggesting the level has already been tested too many times to remain valid.
The information is on the chart. The trader is not blind. The trader is filtered.
This compounds because each session of staring narrows the filter further. The trader spends more time on the elements that support the thesis and less time on the elements that contradict it. After enough hours, the contradicting elements may as well not exist. They are no longer part of the perceived chart.
The market the trader is responding to is not the market that prints. It’s the subset of the market their attention permits them to see.
This is the part most traders miss entirely.
A rule, written down before the session starts, is a contract with the version of yourself that was calm. “I will enter on a confirmed close above the level.” “I will not chase if price moves more than 0.5% past my entry.” “I will exit if the daily structure breaks.”
The rule was clear when it was written. The rule was honest. The rule was the product of the first, uncommitted reading of the market.
Three hours into staring, the rule is still on paper. But the line the rule references has moved. The level you said you’d wait for is no longer where it was. The structure you said would invalidate the trade has been redrawn. Technically you’re still following the rule. Functionally, you’re following a rule whose terms have shifted under it.
This is why traders break their own rules without ever feeling like they did. The break is invisible to the trader. They followed the rule. They just followed it against a chart that no longer matches the one the rule was written for.
The redrawn line replaces the original rule. Quietly. Without announcement. The trader walks into a trade they would not have taken at the start of the day, convinced they’re doing exactly what they planned.
While the trader is staring and redrawing and rotating timeframes, the market is doing something simpler. It’s continuing. Sellers are selling. Buyers are buying. Positions are rotating between participants who do not share the trader’s thesis and do not care whether the trader enters or not.
The setup the trader convinced themselves exists may or may not be visible to anyone else. In most cases, it isn’t. The market sees continuation, range, drift, or noise. The trader sees a setup because the trader needed one to exist.
This is the asymmetry. The trader is participating in a chart that exists primarily in their attention. The market is participating in a chart that exists in prints. The two are not the same chart.
When they diverge enough, the trade fails. Not because the analysis was wrong, but because the analysis was being done on something other than the actual market.
The remedy isn’t more analysis. More analysis deepens the loop.
The remedy is leaving the chart and coming back later with the bias cooled. An hour helps. A day helps more. The thesis that felt urgent in the moment often looks thin in the morning. The trend line that was carefully nudged into supportive territory often looks arbitrary the next time it’s opened.
This is uncomfortable because it implies the work done during the staring session was not work. It was rationalization. The trader did not advance their understanding. They built a case. Cases are not analyses. Cases are pre-decided positions defended with selected evidence.
The traders who avoid this are not the ones who stare harder. They’re the ones who stare less. They take the first read seriously because it’s the only one not yet corrupted by their own desire to act.
Underneath all of this is one mechanism: the trader needs a setup to exist.
Not wants. Needs. There is money waiting to be deployed. There is boredom waiting to be filled. There is a self-image of being an active participant that requires participation. The need to act precedes the analysis to justify the action.
Once that need is present, the chart will be made to cooperate. Lines will move. Timeframes will rotate. Evidence will be sorted. A setup will be found, because one is required.
The cleanest way to avoid this is to remove the need before opening the chart. Decide before the session whether action is necessary. Decide whether the market actually owes you a trade today. The honest answer is usually no.
The chart didn’t change. The trader changed. The trade that appears at the end of three hours of staring isn’t a trade the market offered. It’s a trade the trader manufactured.
The market never asked them to take it.
Every day I track one thing: where market structure and crowd sentiment disagree — and which one leads. Today’s read:
Daily on swaphunt.dev. Same on @SwapHunt. Not financial advice.
The Charts You Stare At Start Looking Like What You Want was originally published in Coinmonks on Medium, where people are continuing the conversation by highlighting and responding to this story.

