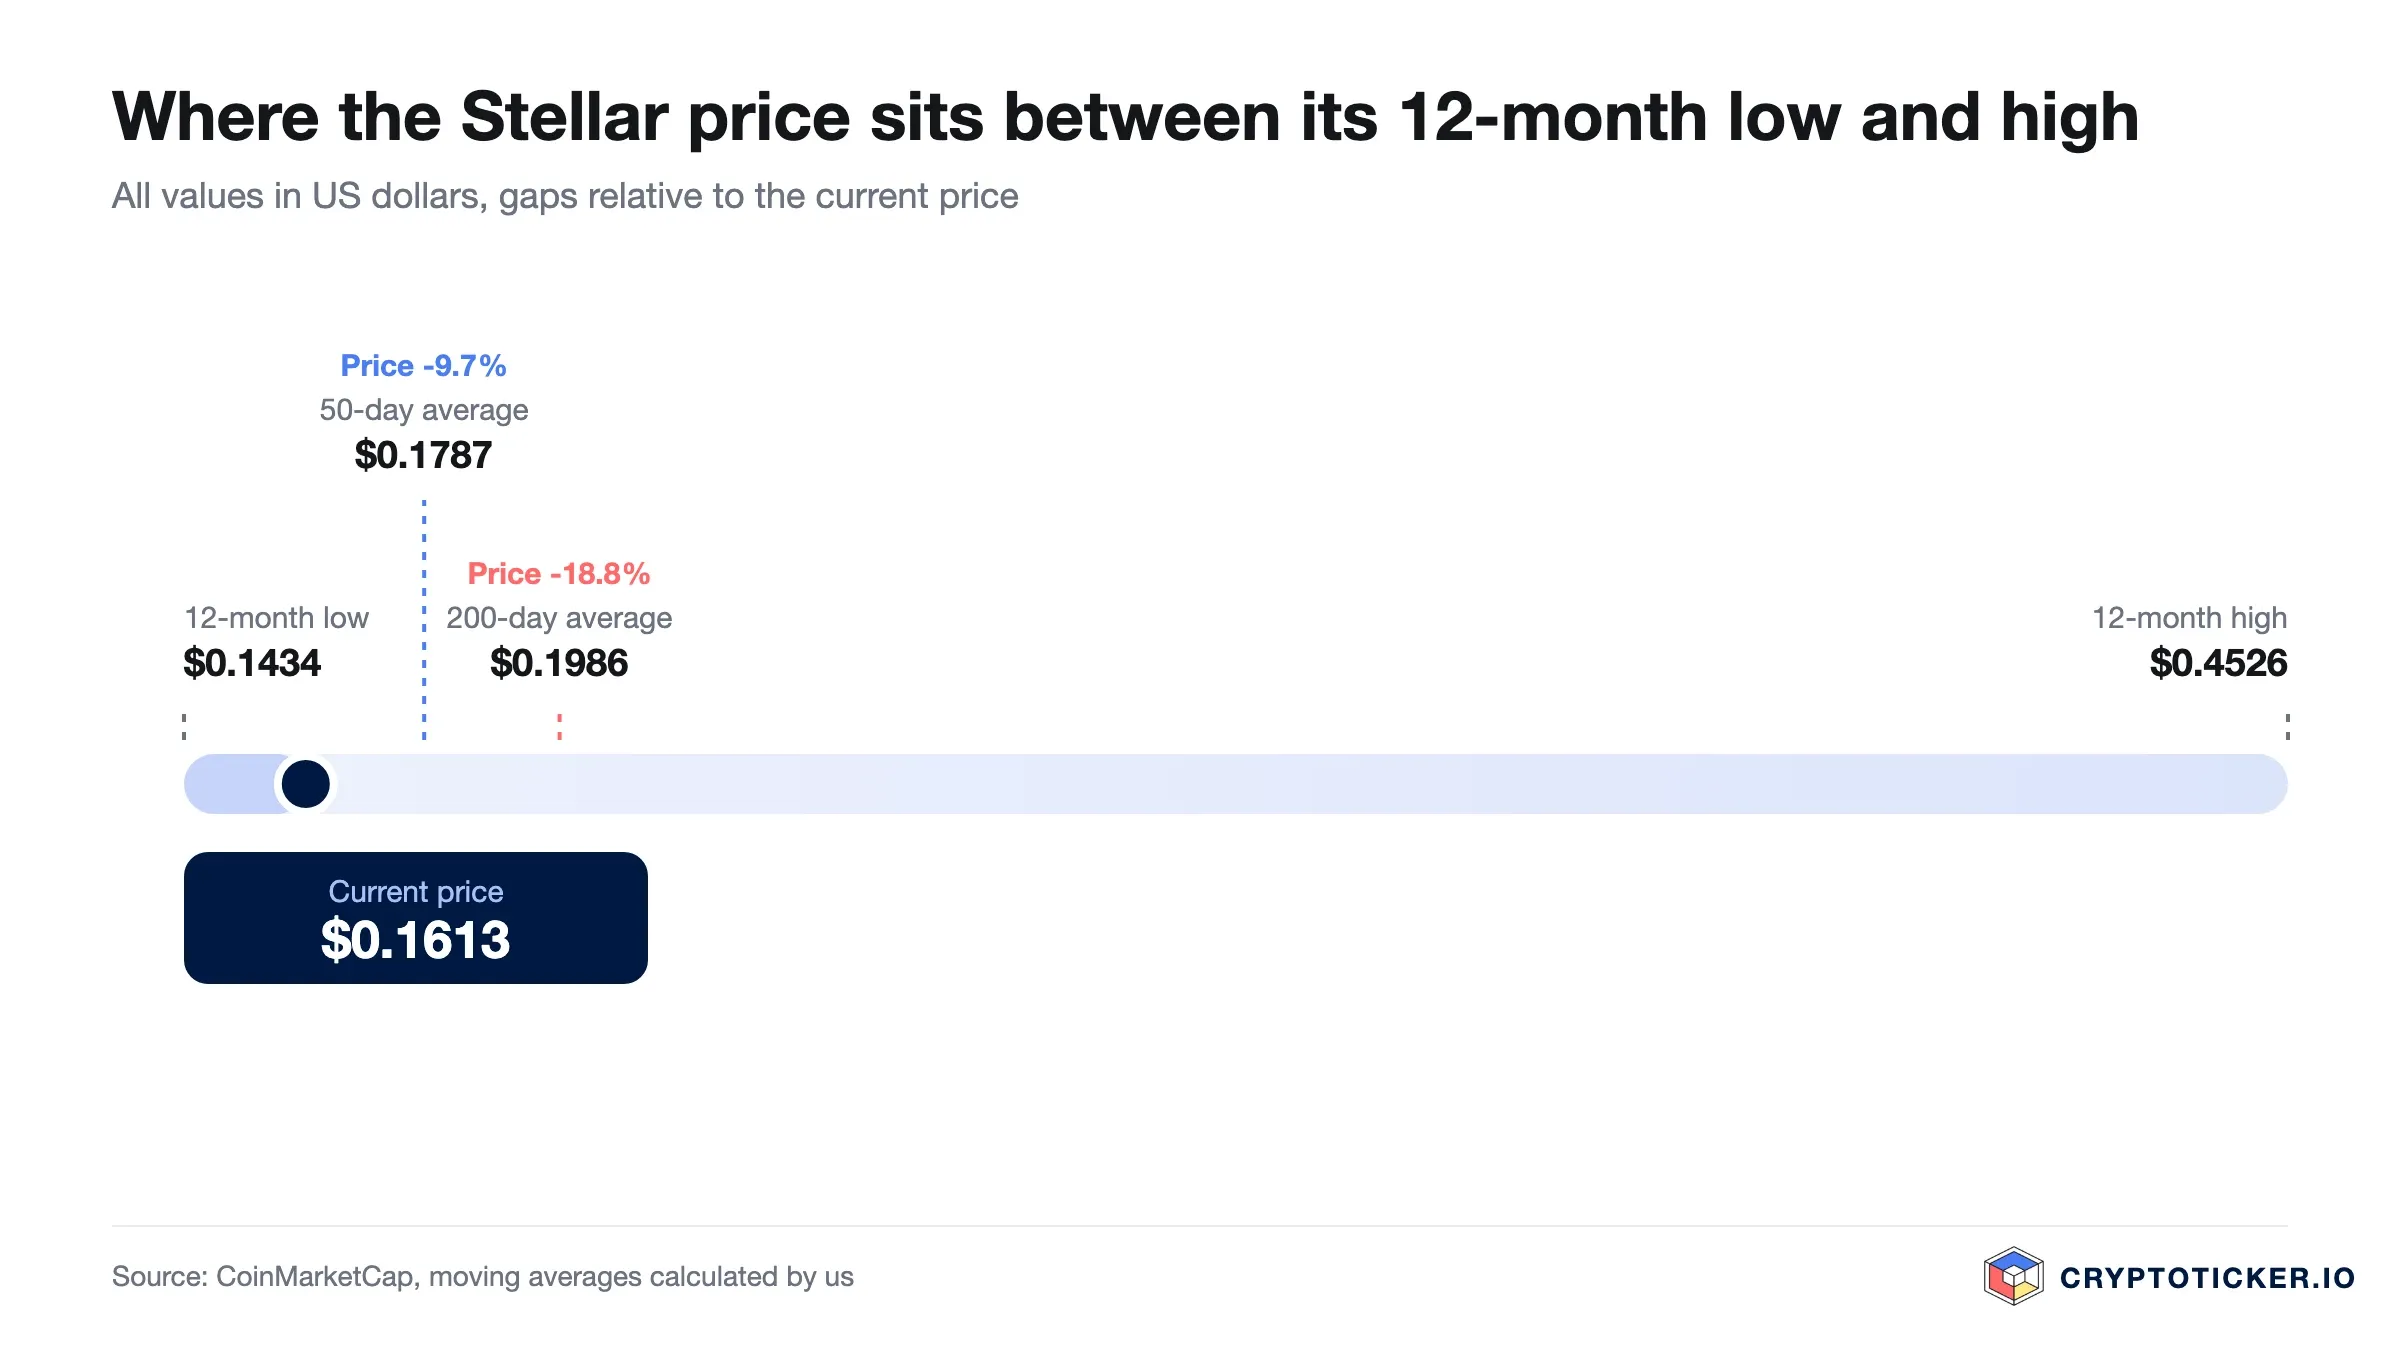
Stellar trades at around 0.1612 US dollars on 12 August 2026. That is 64.4 percent below the twelve-month high of 0.4526 US dollars set on 14 August 2025, and 12.4 percent above the twelve-month low of 0.1434 US dollars from 23 May 2026. The sixteenth-largest crypto asset by market capitalisation therefore sits in the lower third of its yearly range. Is Stellar a good buy at current prices, or is this a weakness that has further to run?
cryptoticker.io compiled the price data for this analysis on 12 August 2026. The market data comes from CoinMarketCap, and we evaluated the daily closing prices of the past 365 trading days up to and including 11 August 2026. The indicators are calculated with standard formulas: the 200-day average and the 50-day average as exponentially weighted means, the RSI over 14 days according to Wilder. Every value changes with each trading day.
The Stellar price of 0.1612 US dollars sits below both moving averages. The 200-day average stands at 0.1986 US dollars and thus 23.2 percent above the current price. The 50-day average stands at 0.1787 US dollars, which XLM would have to gain 10.9 percent to reach. The nearest level to the downside is the twelve-month low of 0.1434 US dollars, reached on 23 May 2026.
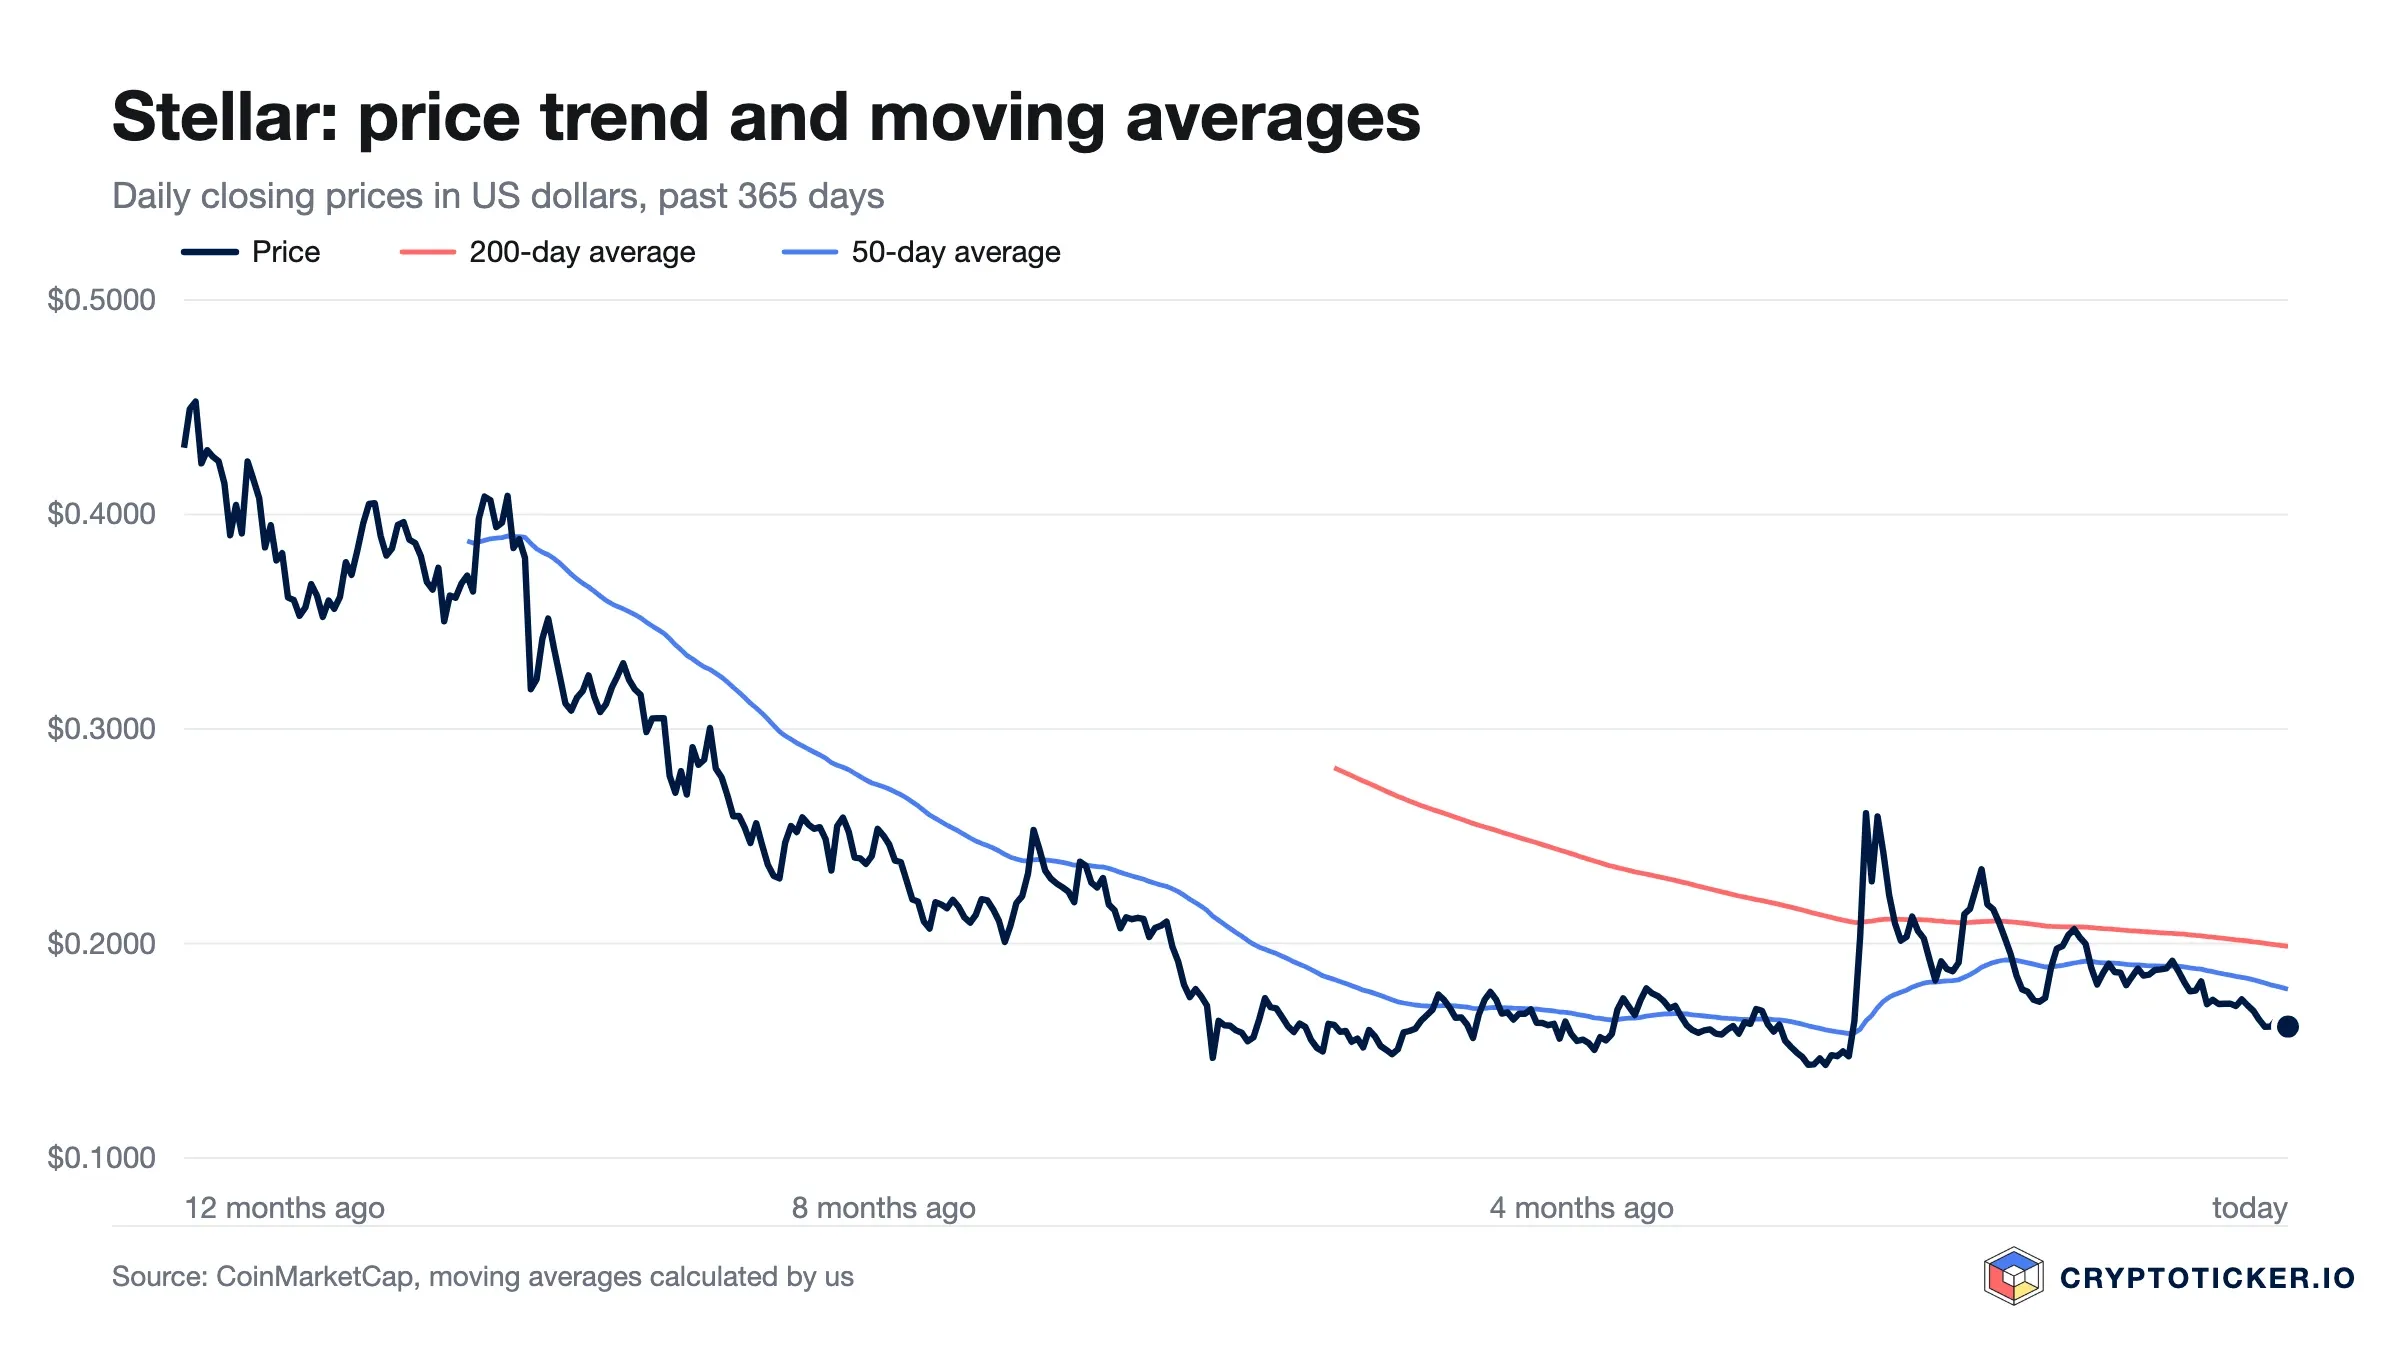
The past 30 trading days span a range of 19.1 percent, from 0.1612 US dollars on 7 August to 0.1919 US dollars on 22 July. Within that range the price has drifted towards the lower edge, and the seven most recent closes all fall between 0.1613 and 0.1686 US dollars. A market that narrows in this way is usually waiting for a reason to move, and the direction is not readable from the chart alone.
Between the current price and the May low the market barely traded over the past year, which means there is little accumulated support in that stretch. Longer-dated scenarios are collected in our Stellar price prediction.
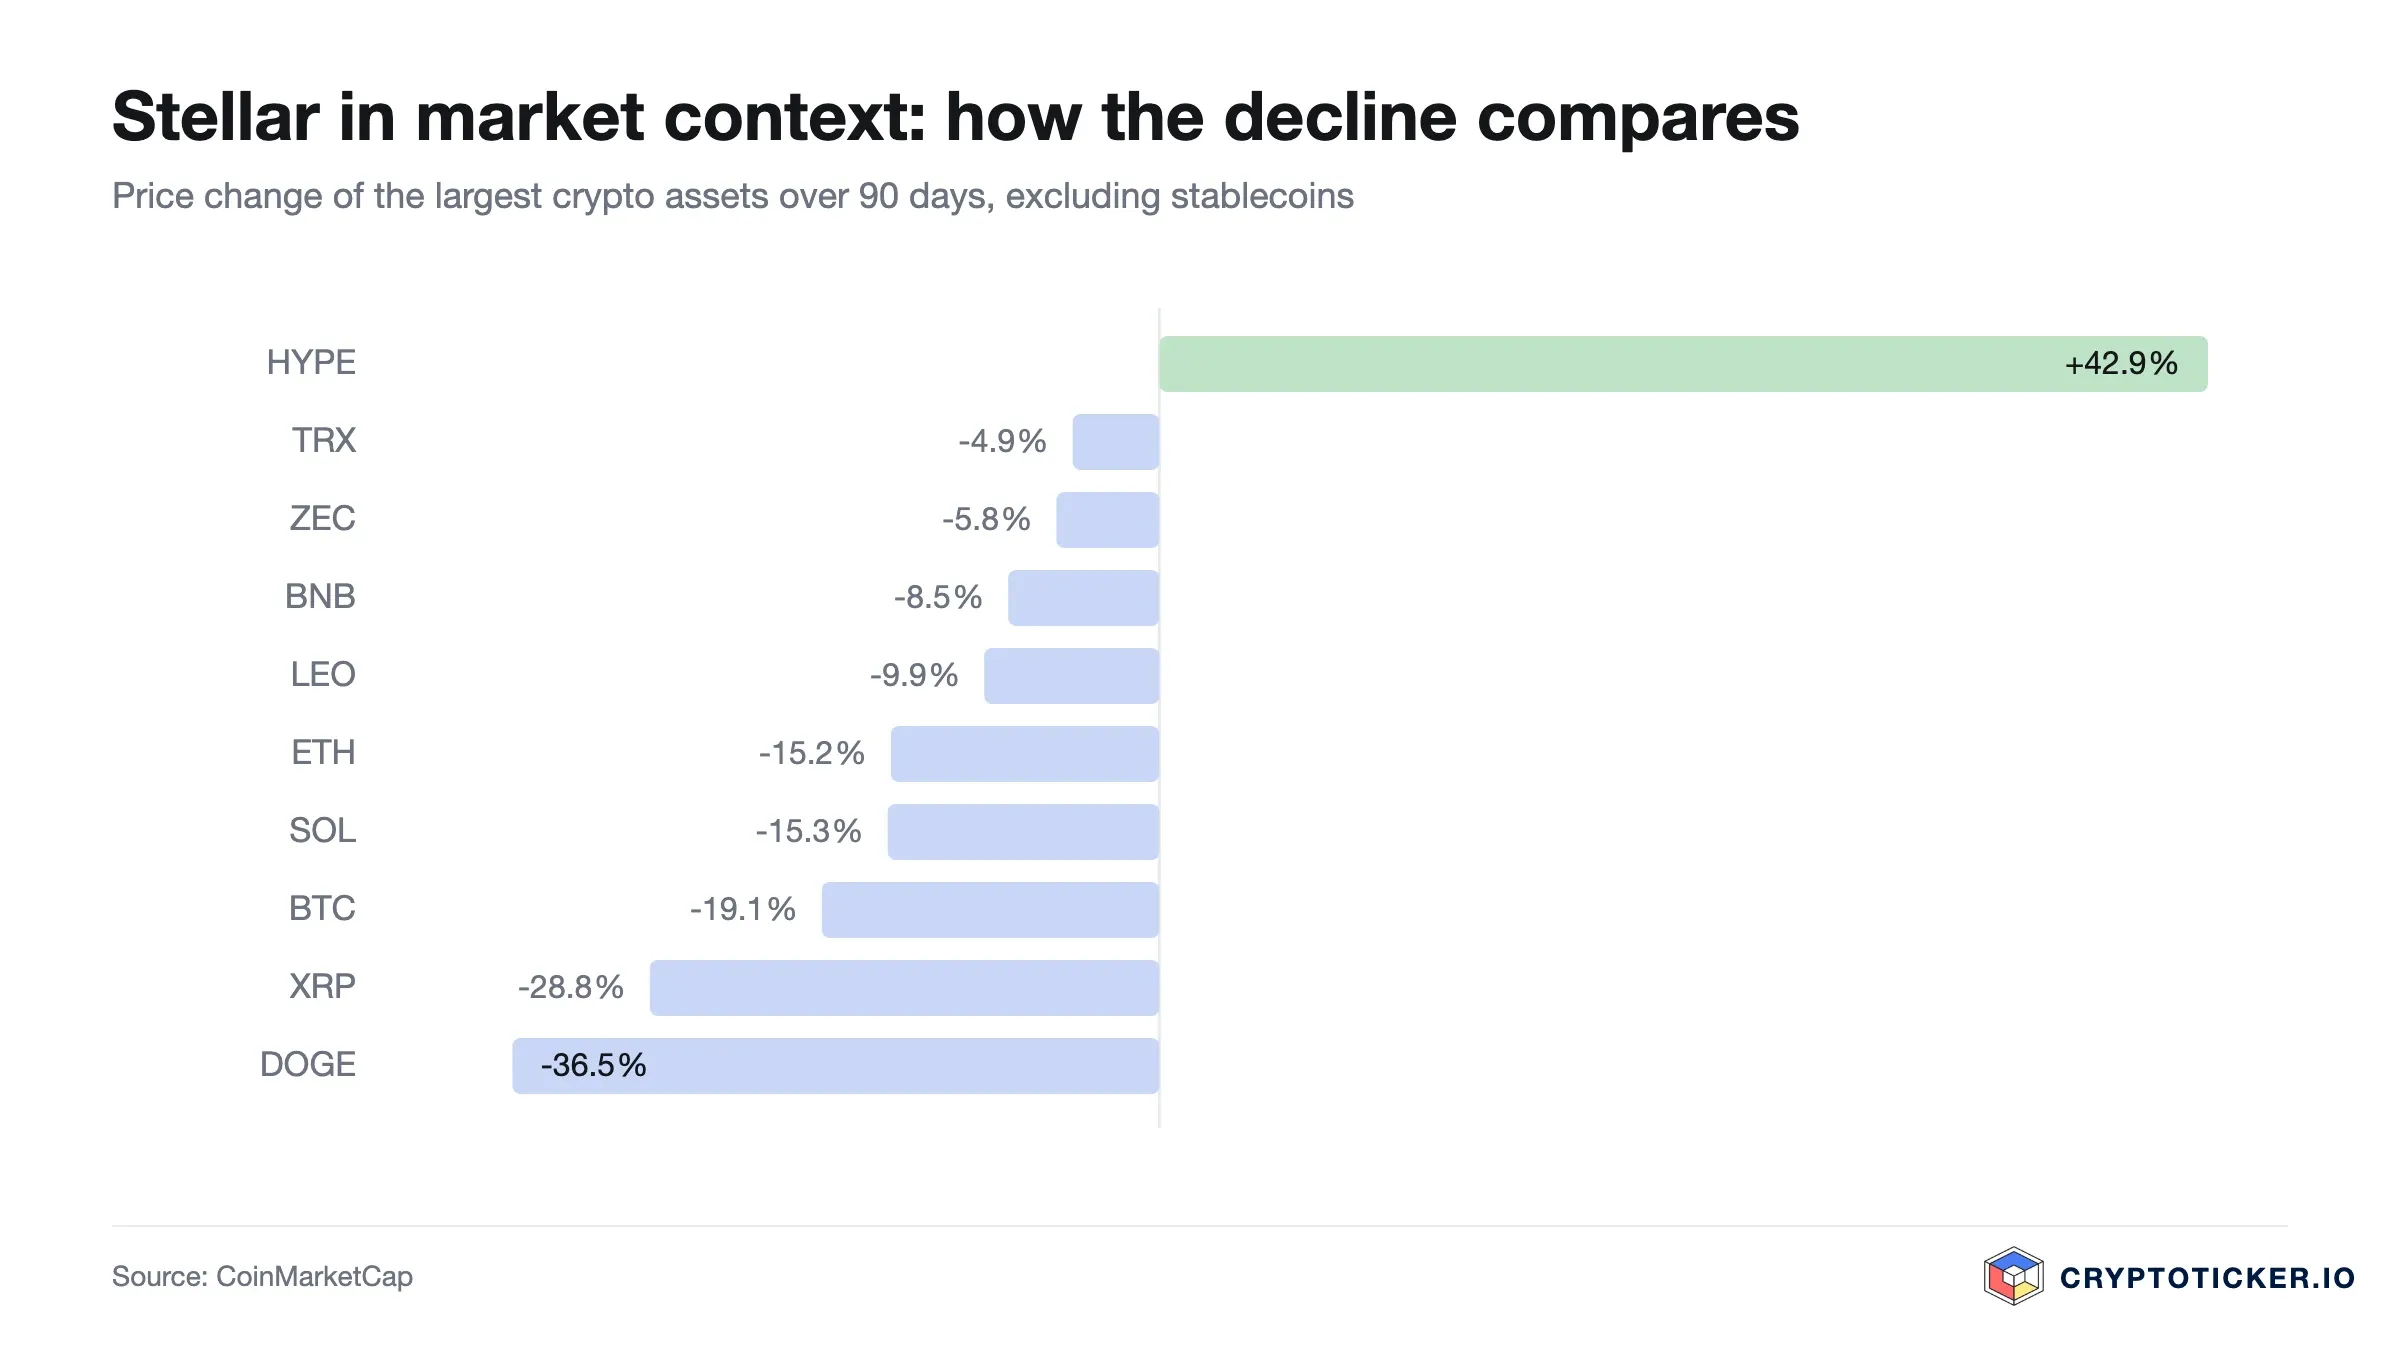
The quarterly figures give a mixed answer. Over 90 days the price is 1.5 percent higher, which is close to unchanged. Over 30 days it is 12.8 percent lower, and over twelve months it is down 62.6 percent from 0.4311 US dollars. The picture is one of a market that stopped falling in the spring without beginning to rise.
The sequence matters. Stellar found its low at 0.1434 US dollars on 23 May 2026 and recovered to 0.2607 US dollars by 30 May. That rally has since given back 38.2 percent, and the price now stands closer to the May low than to the interim high. A downtrend counts as broken once a market sets a higher low and then clears its previous high; Stellar has managed the first half of that condition and not the second.
The most plausible reading in our view is an interruption rather than a reversal. The price has held above the May low for eleven weeks, which argues against an immediate continuation of the fall, and it has failed twice to hold the 50-day average, which argues against a turn that has already happened. Both statements are assumptions drawn from the chart.
The RSI over 14 days stands at 33.9 points. Readings below 30 are conventionally treated as oversold, so Stellar is close to that zone without having entered it. An RSI at this level tells you that the market is weak, and it does not tell you when the weakness ends.
The two moving averages are stacked against the price. With the 50-day average at 0.1787 US dollars sitting below the 200-day average at 0.1986 US dollars, and the price below both, the trend structure is intact to the downside on all three horizons. That configuration has held since the spring.
For an entry this has two practical consequences. Buying at 0.1612 US dollars means buying against the trend, which historically requires either a long holding period or a tight exit. Waiting for a close above the 50-day average means paying at least 10.9 percent more for a market that has confirmed a change. The two routes price risk and certainty differently.
Turnover over the past 24 hours amounts to 80.6 million US dollars against a market capitalisation of 5.56 billion US dollars, a turnover rate of 1.4 percent. The 30-day average sits at 116.5 million US dollars per day. The 90-day average is far higher at 338.6 million US dollars, and the average across the full year is 234.8 million.
The comparison is the informative part. Current turnover runs at roughly a third of the 90-day average and at about a quarter of the twelve-month average. Trading interest in Stellar has thinned considerably since the spring, and the thinning coincides with the drift towards the yearly low.
Thin volume cuts both ways for a buyer. A market that few people trade needs less capital to move, so a return of interest can lift the price quickly. The same thinness means larger orders move the price against the person placing them. Where trading costs are lowest differs by venue, and our exchange comparison sets the fee models side by side.
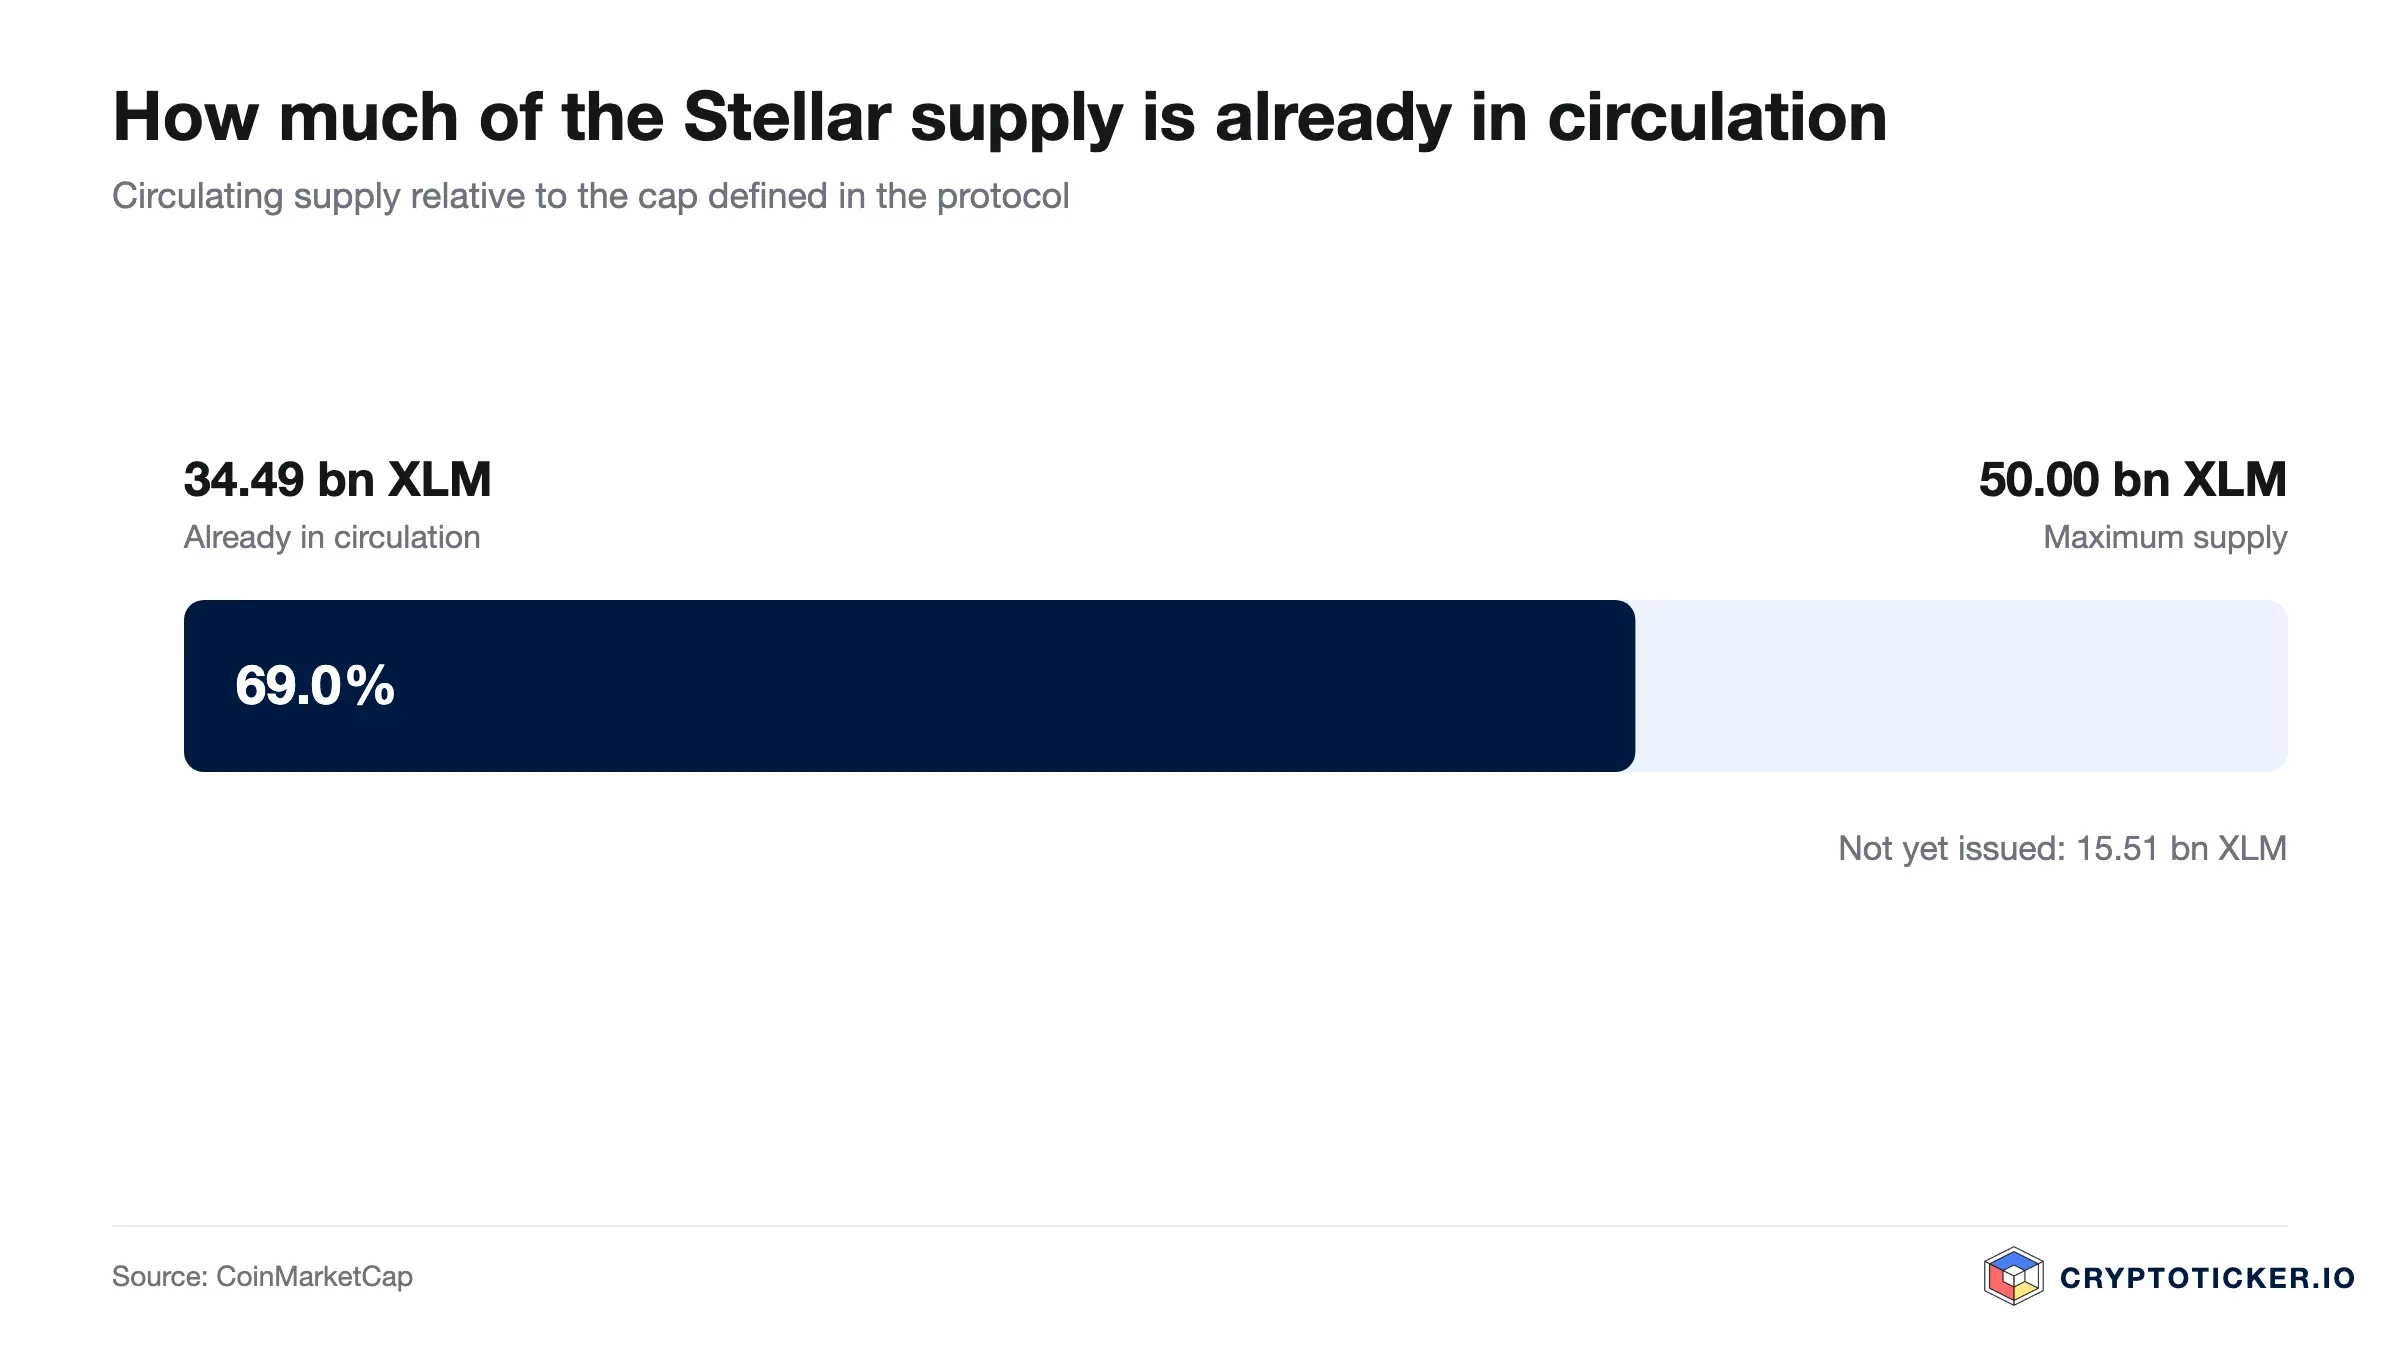
Stellar's supply is capped and largely issued. Of a maximum of 50.0 billion XLM, 34.49 billion are in circulation, which is 69.0 percent. The remaining 15.5 billion sit with the Stellar Development Foundation and are released according to published mandates. There is no ongoing inflation in the sense of newly mined units, and the foundation burned roughly half of the original supply in 2019. The details of the model are documented on the Stellar Lumens overview.
The network's purpose is payment settlement and asset issuance rather than general-purpose computation, with a stated focus on cross-border transfers and tokenised deposits. The documentation for issuers and anchors is published at developers.stellar.org. Whether that focus translates into sustained demand for the asset is a separate question from whether the network is used, and the two have diverged before.
On regulation, European rules now apply in full to service providers rather than to the asset. The European Securities and Markets Authority supervises the framework and publishes the register of authorised firms. For a buyer in the European Union the practical effect is that the venue matters as much as the coin, and the comparison of regulated exchanges tracks which providers hold which permissions.
Three arguments carry weight at 0.1612 US dollars.
Three arguments point the other way.
Three cost blocks decide what an entry actually costs. The trading fee is charged per order and typically ranges from about 0.1 percent on maker-taker models to well above one percent on simplified buy interfaces. The spread between bid and ask is not shown separately. The withdrawal fee applies when you move XLM off the exchange, while the on-chain cost on the Stellar network is a fraction of a cent.
The provider question separates two use cases. For a position you intend to trade, an exchange account with low per-order costs is usually adequate; our Kraken review covers one such venue. For a position you intend to hold, the relevant criteria are the provider's regulatory permissions and its withdrawal terms, which our Bitpanda review examines.
Custody is the second decision. Coins left on an exchange are a claim against that exchange rather than an asset you control, which is acceptable for a short holding period and less so for a long one. Moving XLM to your own wallet removes that counterparty risk and adds the obligation to secure a recovery phrase. Suitable devices are ranked in the hardware wallet comparison.
Over a short horizon the evidence is unfavourable. The RSI at 33.9 points, the price below both averages, and turnover at a third of its 90-day average describe a market without a catalyst. The nearest resistance is the 50-day average at 0.1787 US dollars, 10.9 percent away, and the nearest support is the twelve-month low at 0.1434 US dollars, 12.4 percent away. Risk and reward are roughly symmetric on those two levels, which is a poor ratio for a directional trade.
Over a horizon of several years the calculation rests on different inputs. A capped supply that is 69.0 percent issued, a network with a defined purpose, and a price 64.4 percent below its twelve-month high are the conditions under which long-term positions have historically been built in this asset class. None of that establishes that a recovery will occur, and the 62.6 percent twelve-month decline is a reminder that discounts can deepen.
The assumption of a floor counts as disproved if the price closes below the twelve-month low of 0.1434 US dollars on a daily basis. It counts as confirmed if XLM reclaims the 50-day average of 0.1787 US dollars and closes above it on rising volume. The test after that would be the 200-day average at 0.1986 US dollars. These three levels let you check your own assessment against the market rather than against an opinion.
Disclosure: Some of the providers mentioned in this article work with us through partner programmes. This has no influence on the price analysis or on our assessment of the chart; the price data comes from a public market data source and can be verified there.
(As of 12 August 2026. This article is not investment advice. Prices, fees and terms change; check them with the provider before every purchase. Crypto assets are subject to high price volatility and a total loss is possible.)





