
Sui (SUI) is regaining momentum, showing a steady rise in value and attracting increasing attention from investors across the crypto market. Its price has surged by 1.78% over the last 24 hours but is down by 19.6% over the last week.
At the time of writing, SUI is trading at $2.78, supported by a market capitalization of $10.09 billion. Moreover, its trading volume decreased 34.13% to $1.47 billion, suggesting that traders are staying on the sidelines until a clear price direction develops.
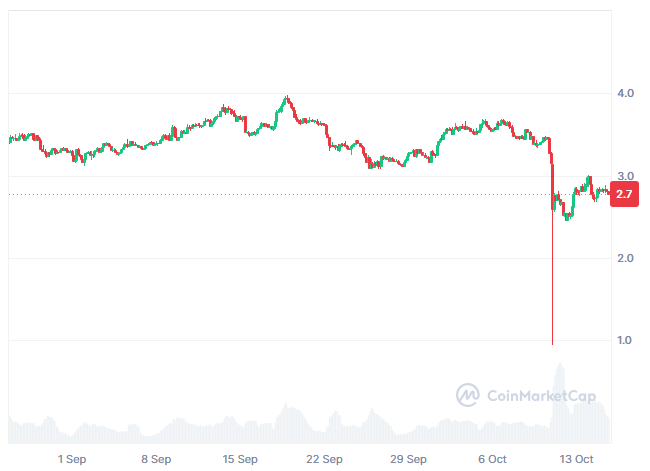
Source: CoinMarketCap
The community sentiment reveals that 84% of voters are bullish, showing strong optimism and confidence in the market’s potential growth. This overwhelming majority believes that prices are likely to increase steadily over time. Such a high level of positivity indicates strong trust and enthusiasm among investors.
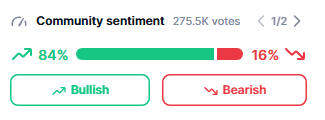
Source: CoinMarketCap
In contrast, 16% of voters are bearish, suggesting that a smaller group anticipates a possible downturn or correction. These participants may be cautious about future market conditions and short-term volatility. However, despite their concerns, the overall sentiment remains clearly and decisively bullish.
Also Read: SUI Rebounds Strongly, Eyes Explosive $5 Breakout Soon
Additionally, crypto analyst Daniel Ramsey provided that SUI has a distinct symmetrical triangle shape that defines a stage of re-accumulation and consolidation. The price action maintains regular higher lows while consecutively testing the higher resistance trendline again and again and demonstrates increased bullish momentum. A confirmed break above this resistance will provide a strong continuation of the uptrend.
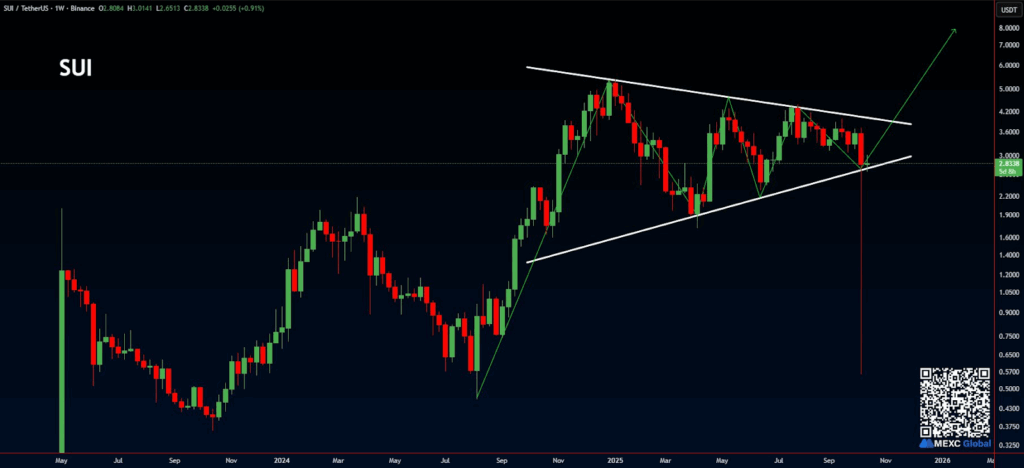
Source: X
If the breakout happens, the experts set a target between $7.00 and $8.00 based on the triangle’s calculated move. This breach may draw higher trading volume and aggressive bullish momentum, supporting the higher trajectory. A downward break below the uptrend support line will negate the chart pattern and may initiate a retardation phase prior to a recovery move.
The chart indicates a sudden fall below the lower Bollinger Band in early October, hinting at strong selling pressure. Now the price has stabilized above $2.77 but remains below the mid-band resistance of $3.23. This indicates that bearish momentum is dominant, but short-term stabilization is emerging.
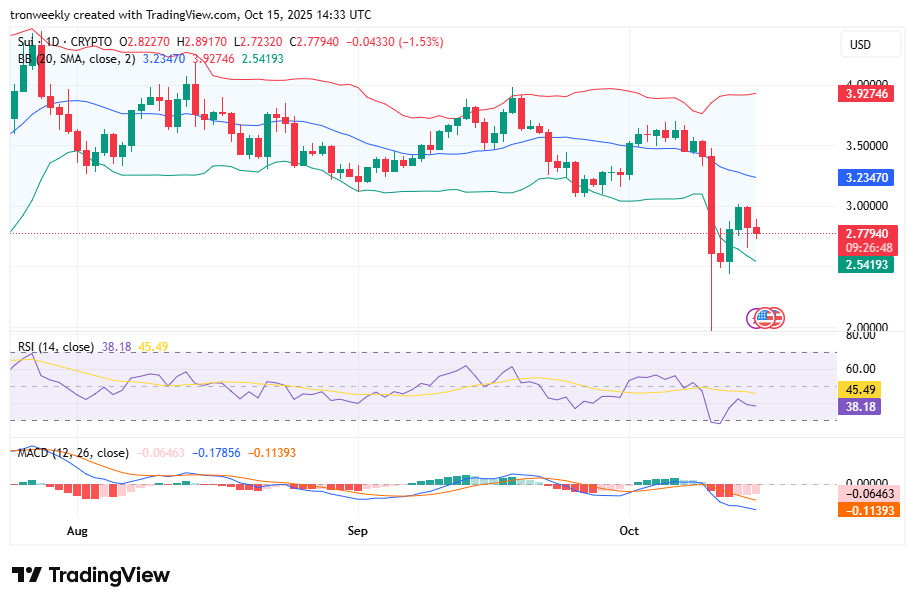
Source: TradingView
However, the RSI at 38.18 states poor momentum, recovering by a bit from the oversold levels. MACD lines are still bearish, with the MACD line positioned below the signal line, validating bearish pressure. But the decreasing histogram bars are a sign of a potential slowing in the downtrend.
Also Read: Sui Price Outlook: Key Support at $2.60 Could Ignite Rally Toward $8


