
SUI has demonstrated subdued price movement as the asset trades within a critical support zone following a period of extensive consolidation. Market sentiment remains apprehensive, with analysts reviewing resistance levels and other cycle indicators to determine the current market outlook for the token.
On March 8, SUI is trading at $0.8802, showing a decline of 2.22% in the past 24 hours. The trading volume is currently standing at $267.91 million, down 11.34%. The token has lost 3.47% over the last seven days, according to CoinMarketCap data.
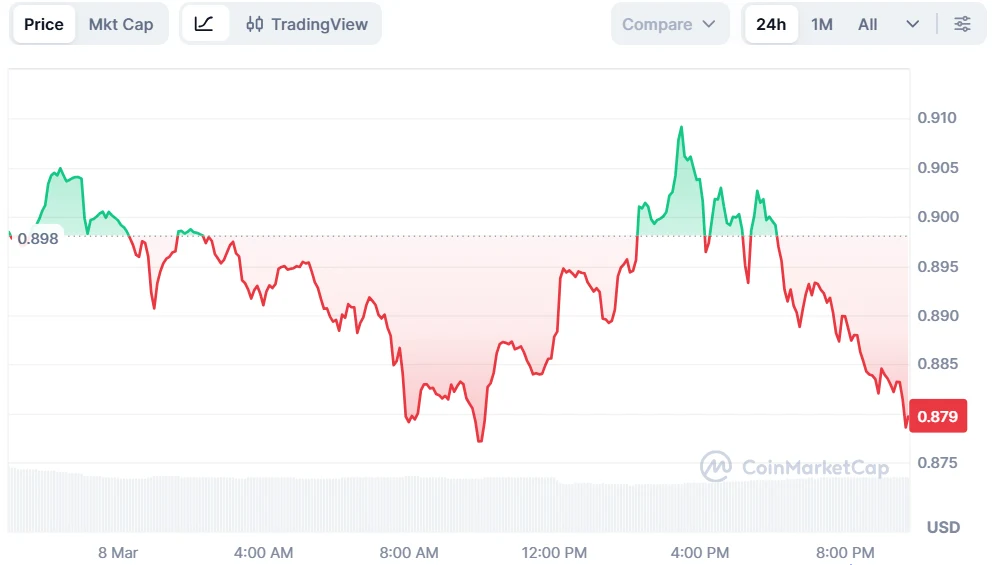
Source: CoinMarketCap
A prominent analyst, BitGuru, highlighted that the price of the SUI token holds steady after long periods of consolidation. He explained that the price has stabilized at the $0.87 level.
If the price breaks this level, it is possible that the price may rise to the $1.01 to $1.05 resistance level, as this level has been the price limit for the previous attempts.

Source: X
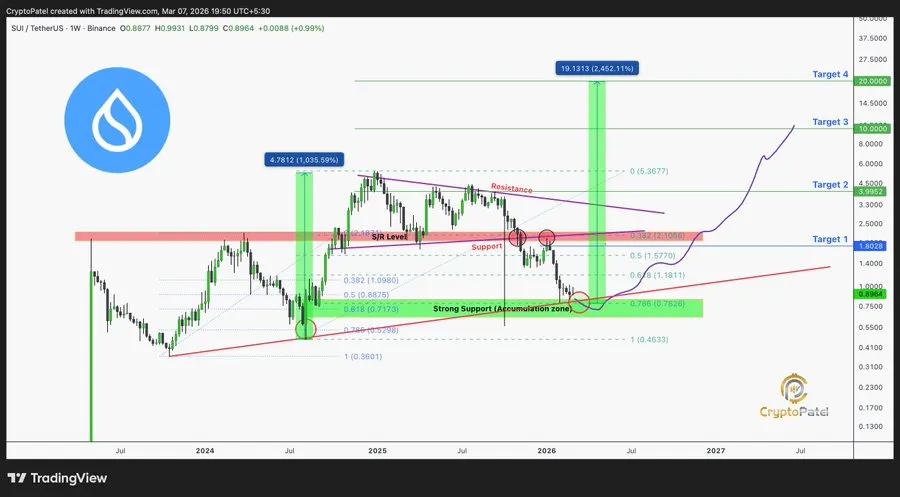
Additionally, another analyst, Crypto Patel, also presents a different long-term analysis. He mentioned a deeper retracement to the 0.786 level. He also added that the pattern follows a macro ascending trendline.
He points to the similarity with the 2024 accumulation period. The period experienced a sharp expansion after a long compression.
Also Read: Sui Price Forecast: Can SUI Reach the $1.50 Target in March 2026?
Patel also mentions various targets to the upside if the support holds. These levels are $1.80, $4.00, $10, and $20.
He also emphasizes the importance of a weekly close above the $0.50 level. He refers to this level as the line that defines the trends. A close below this level negates the outlook.
Source: X
According to analysts, deep moves within larger uptrends typically represent the early stages of strong cycles. He says that these cycles often start within retracement zones, as opposed to at their peaks.
From a technical perspective, SUI is still trading below all major exponential moving averages. The EMA20 sits at $0.9375, while the EMA50 is at $0.9831, forming the first resistance cluster above the market.
The higher trend indicators add more weight to the broader decline. The level of the EMA100 is $1.0928, while the level of the EMA200 is $1.3783. These levels indicate a strong resistance level for SUI as it currently trades below all four EMAs.
The Bollinger Bands indicate a low level of volatility as the bands tighten. The upper band is at $0.9831, the middle band is at $0.9205, while the lower band is at $0.8580. This reflects a compressed pattern with low expansion signals.

Source: TradingView
However, SUI is trading within a tight range. It’s contained within compressed volatility signals and strong support levels. The price action within this area will dictate whether the bulls pick up speed or the bears resume their dominance.
Also Read: XRP Stuck Below $1.80 Resistance With Risk of Drop to $0.91

