
SUI is currently in a narrow range as analysts await to see if the correction is nearing an end. The asset is under short-term pressure but is showing several technical indications of a potential consolidation in the support zone.
At the time of writing, SUI is trading at $0.8948, with a 24-hour trading volume of $344.14 million and a market capitalization of $3.48 billion, according to market data from CoinMarketCap. The token has recorded a 1.25% decline over the last 24 hours.

On March 8, 2026, a crypto analyst, More Crypto Online, released a market update that indicated that SUI may still be forming wave 2 of a larger pattern. According to the analysis, SUI is within a larger sideways range, with zones acting as support areas to predict the future course of the coin.
The main area of support for this range is centered around $0.815-$0.837. In the near term, a secondary area of support has been identified in the range of $0.85-$0.899, with the price now touching this area’s higher end.
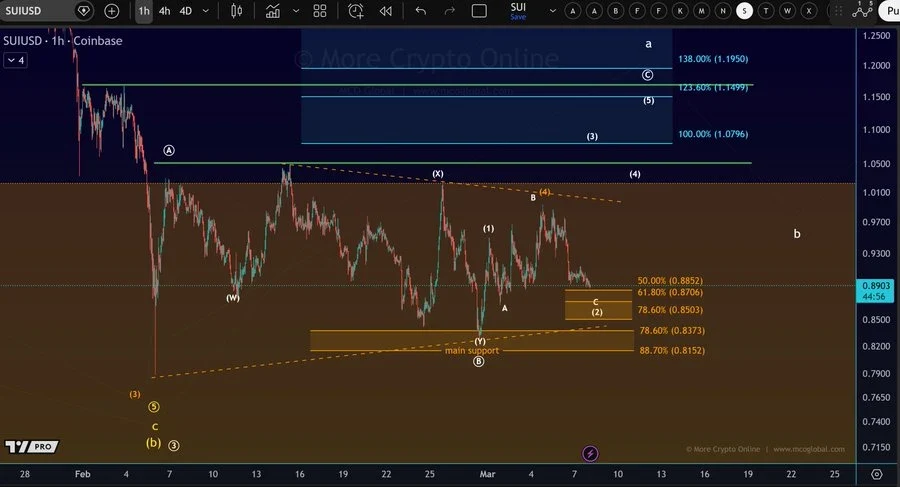
For the current technical scenario to be valid, it is important to see a stable response from the markets in this range in the days to come. Holding above this range could help maintain the price structure and set it up for the next move upwards.
However, if the SUI price fails to stabilize around this support zone, the analysis suggests that the circle wave B could be an ongoing development for the correction. This means that the market may not be done with the current correction phase.
A break below $0.85 seems to be a clear indicator of a potential move lower, and if this level does not hold, it could potentially set the stage for a move down towards $0.60, where the next level of support could be established, according to More Crypto Online.
Also Read | Filecoin (FIL) Consolidation Phase Signals Potential Breakout Toward $12
Furthermore, technical indicators also reveal that SUI is still facing some pressure even though it is showing signs of stabilization. Currently, the price is trading below various levels of the moving average ribbon, such as $0.921, $1.090, $1.342, and $2.075.
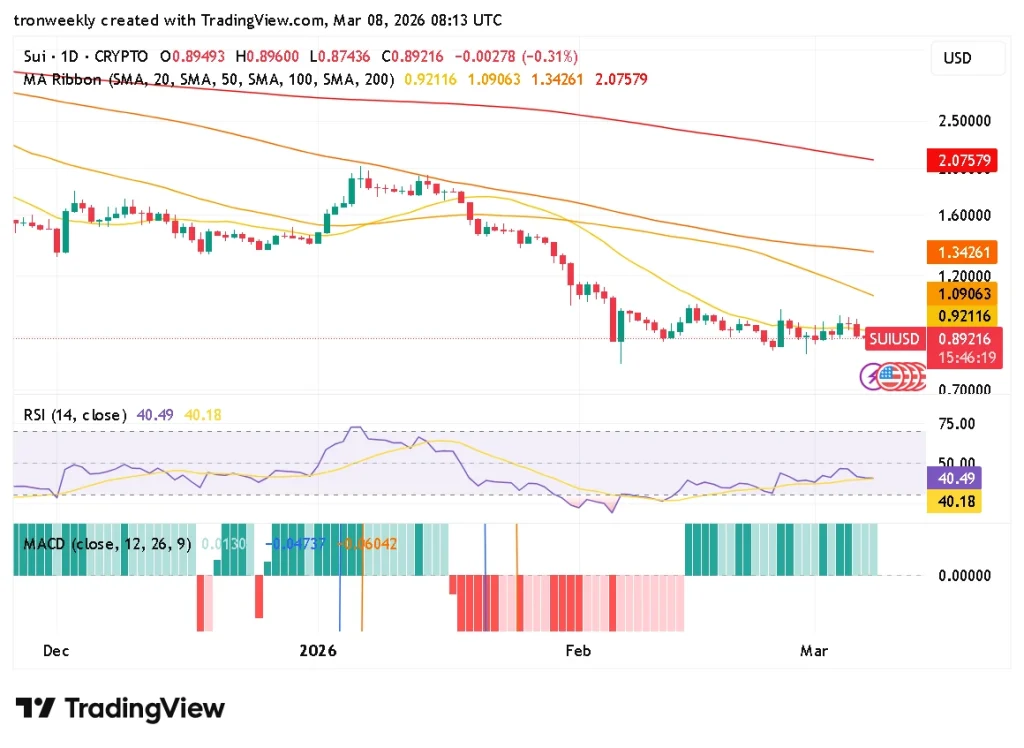
The Relative Strength Index (RSI) is around 40.49, while the signal line is around 40.18. This is a sign of weak momentum but shows some improvement compared to previous sessions. It seems that the demand side is trying to curb the fall, but needs to improve further.
The MACD is around 0.0130 with a signal line at -0.04737. The histogram has become positive after a series of negative readings, indicating selling pressure may be abating.
According to analysts, more buying needs to occur before an uptrend can be established. SUI is currently at a precarious position where the levels of support will determine whether the trend stabilizes or the correction continues.
Also Read | XRP Breakout Alert: Historical Trends Hint at 2,000% Potential Move

