The Bitcoin price is currently navigating a high-stakes consolidation phase, trading at approximately $74,272 during the March 18, 2026, session. After a period of bearish dominance that saw the asset retreat from its 2025 record highs, the market is now testing the resilience of the $74,000 resistance zone.
Analyzing the BTC/USD 4-hour chart, we observe several key technical patterns that define the current trend.
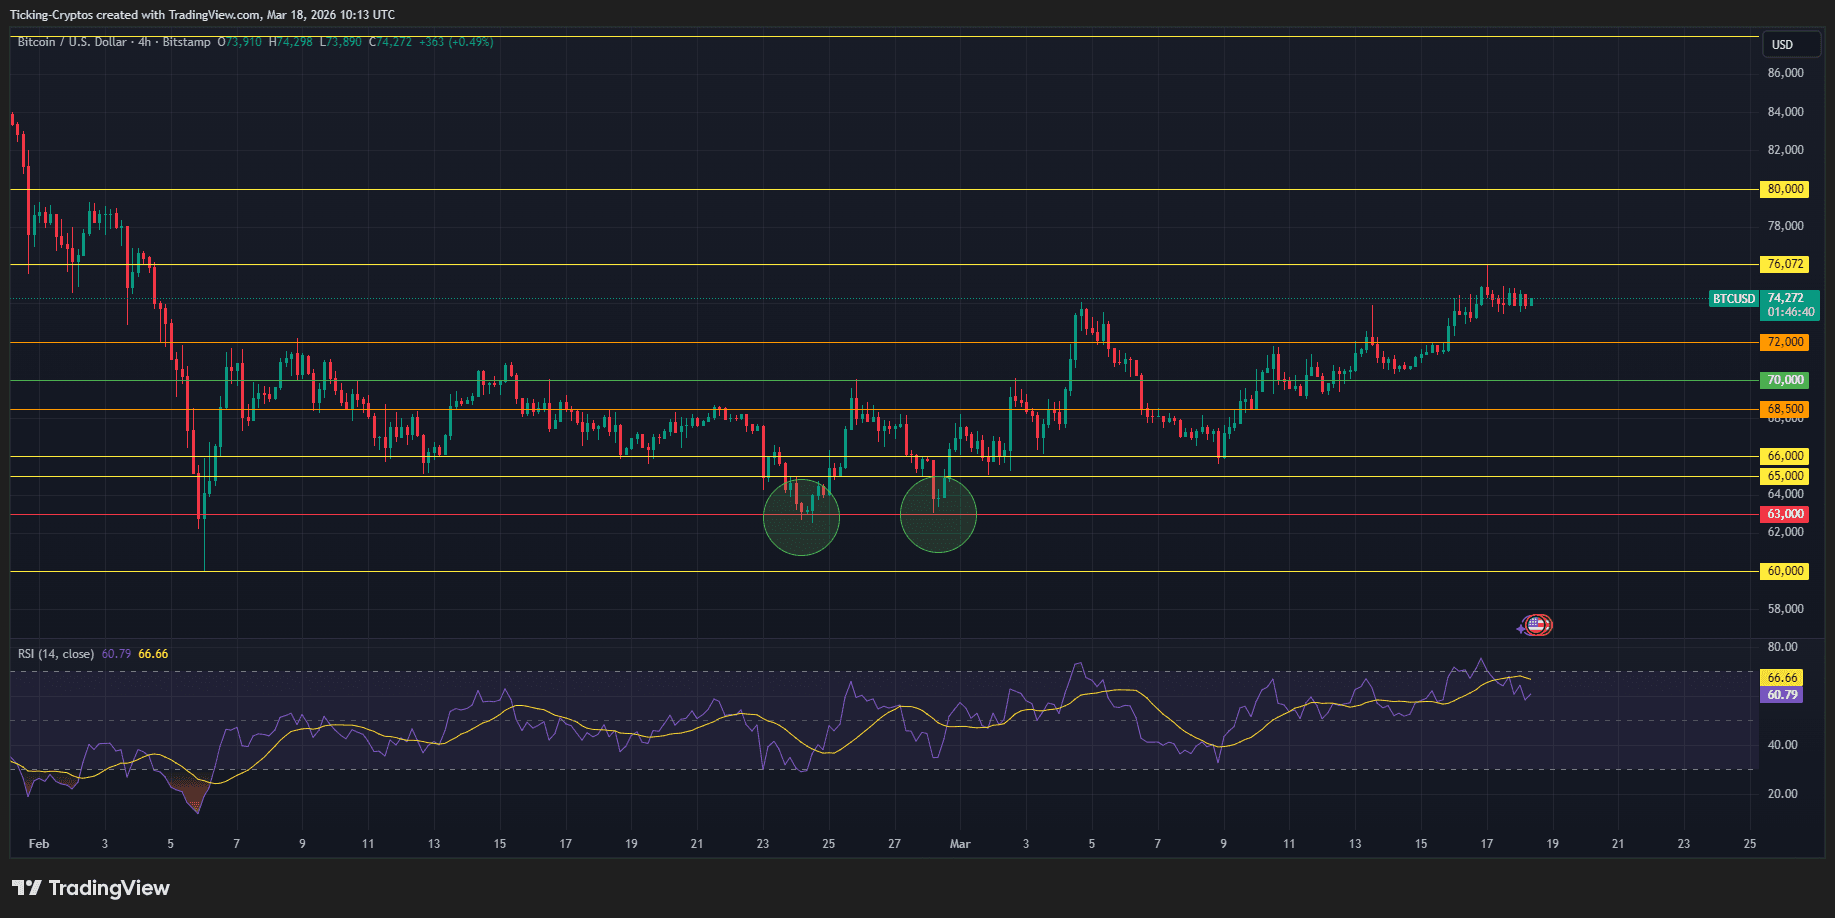
The chart highlights two significant "troughs" (marked with green circles) near the $63,000 level. This Double Bottom formation served as a powerful reversal signal in late February and early March, allowing Bitcoin to climb back above the psychological $70,000 mark.
The price action is currently sandwiched between tightly defined horizontal levels:
The Relative Strength Index (RSI) is currently hovering around 60.79. While this indicates bullish momentum, the RSI has flattened significantly as the price approaches resistance. This suggests a "cooling off" period or a potential bearish divergence if the price makes a higher high while the RSI fails to follow suit.
The broader crypto market is currently characterized by a "Fear" rating on the Sentiment Index (sitting at 26), despite Bitcoin's recent price recovery.
Bitcoin is showing "Experience" and "Expertise" in its ability to hold the $74,000 handle despite a heavy macro environment. However, the information density on the 4-hour chart suggests that the current range is exhausting.
If Bitcoin can flip $76,000 into support, a run toward $80,000 is the most likely scenario. Conversely, a rejection here, coupled with a hawkish Fed, could see a swift retest of the $68,500 support.


