
The coin has shown remarkable resilience in defending critical levels, suggesting that the trend is not just speculative but backed by consistent support.
With meme coins often prone to sudden swings, the asset’s patient buildup separates it from the usual hype-driven movements. If the upward pressure holds, a significant breakout could be on the horizon.
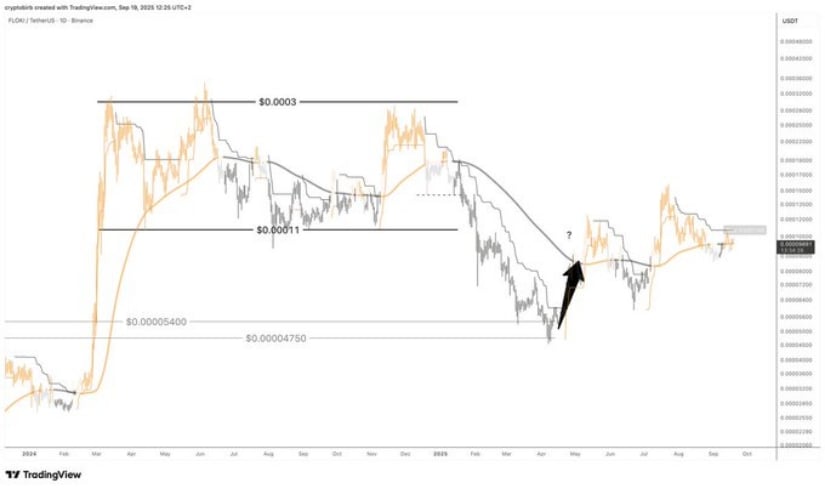
In a recent X post, CRYPTOBIRB highlighted that $FLOKI is on a steady climb marked by higher highs and higher lows, indicative of a strong bullish trend. The chart shows a key resistance level at $0.00011, which represents a crucial breakout point for the continuation of this momentum.
This price area acts as a technical barrier that, once overcome, could validate the long-term bullish trend currently in place.
Source: X
The broader pattern reflects a slow and steady ascent following strong defenses of critical lows earlier this year. The memecoin’s price action shows a level of resilience rarely seen in meme coins, which are often defined by abrupt volatility.
Support zones around $0.00005400 and $0.00004750 have consistently held firm, serving as solid foundations for the ongoing rally and reinforcing the upward trajectory.
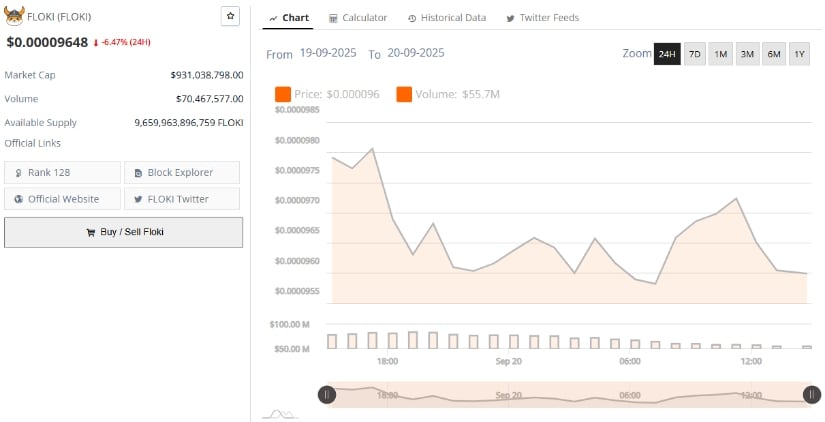
Supporting the bullish view, BraveNewCoin data shows the coin trading at $0.00009648, marking a -6.47% decline in the past 24 hours. Despite the short-term pullback, the coin maintains a market capitalization of $931,038,798, with a strong daily trading volume of $70,467,577.
This level of liquidity suggests that interest in the token remains high even during corrective phases, a factor that often precedes renewed upward pressure once momentum stabilizes.
Source: BraveNewCoin
The trading range over the last day reflects consolidation, with price levels moving between $0.0000945 and $0.0000985. Such stability, combined with a consistently large circulating supply of more than 9.65 trillion tokens, highlights the resilience of its market position.
While the immediate dip may appear as a setback, the data indicate that buyers continue to support the coin within tight ranges, keeping the broader uptrend intact as it approaches the $0.00011 resistance.
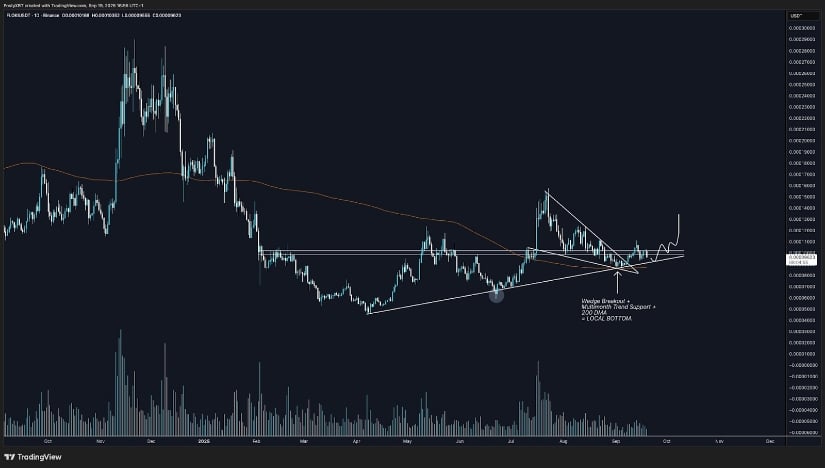
At the time of writing, the coin was trading at $0.00009648, moving within a sideways “chop” pattern near a horizontal support level. According to the chart shared by Posty about 20 hours ago, the price is testing a critical zone at the intersection of a rising trendline and the 200-day moving average (200MA).
This confluence acts as a major dynamic support, and the structure remains bullish as long as both elements hold, allowing for the formation of a higher low.
Source: X
The chart also outlines a wedge breakout pattern, with price action recently pushing above resistance levels to confirm upward momentum. The 200MA and trendline together create a strong technical base, while visible accumulation on the volume bars suggests steady buyer activity.
As long as this support continues to serve as a reliable floor, the broader setup favors continuation to the upside, reinforcing the view that the current consolidation phase is part of a larger bullish framework.


