
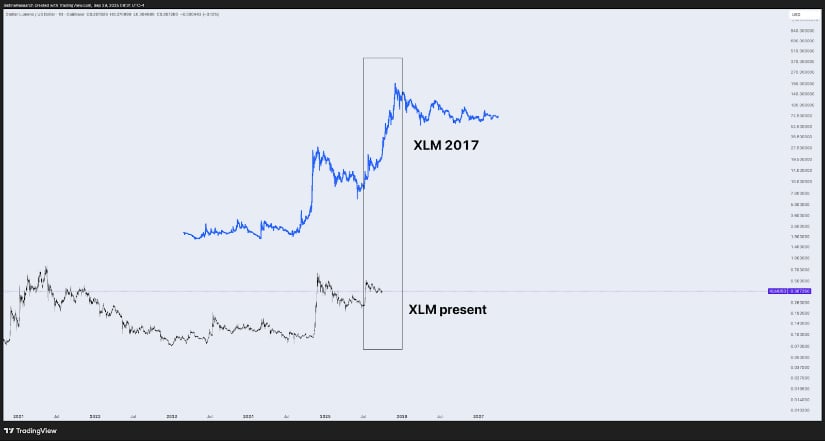
The comparison, described by the analyst as a “clean giga chart,” suggests that history may be rhyming with the asset now sitting in an accumulation phase that could serve as the foundation for a larger move if momentum shifts in its favor.
In 2017, XLM entered a prolonged period of sideways action before launching into a parabolic surge that multiplied its price within months. The latest chart overlay by Sistine Research highlights how the present setup resembles those early pre-rally conditions.
Current price action is consolidating near the base of its long-term range, hovering around $0.37, a level that could mark undervaluation if history were to repeat.
Source: X
The analyst emphasized that this type of accumulation phase often goes unnoticed until a breakout occurs, with most of the rally happening in a compressed timeframe. For patient investors, such parallels provide a reminder that cycles in crypto markets tend to follow familiar rhythms, even if the catalysts behind them evolve.
This observation does not guarantee a replay of the 2017 run, but it does underline that the cryptocurrency is trading in a zone historically associated with the start of stronger momentum. If confirmed, the present consolidation may be the calm before another significant expansion.
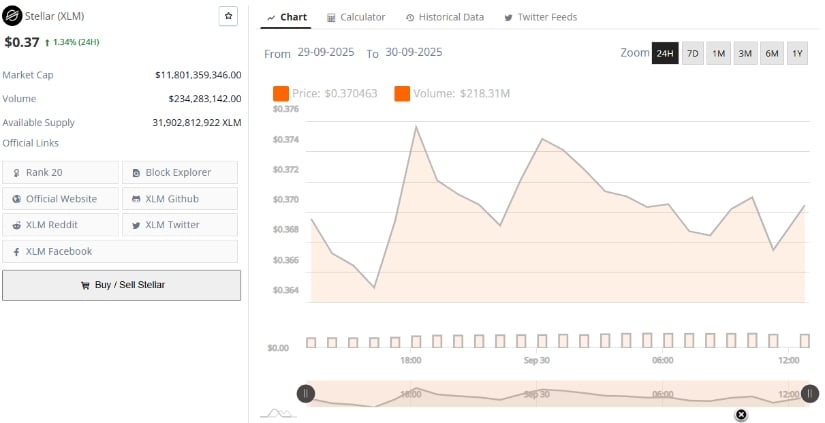
According to market data, Stellar is trading at $0.37, reflecting a 1.34% gain in the past 24 hours. Its market capitalization stands at $11.8 billion, ranking it 20th among cryptocurrencies. Trading volume has reached $234 million over the same period, suggesting a healthy level of liquidity supporting the token.
Source: BraveNewCoin
The current supply of the asset in circulation is more than 31.9 billion tokens, underscoring the project’s scale as a payments and remittances-focused blockchain. While the recent price appreciation is modest compared to past rallies, the ability to hold steady above the $0.36–$0.37 zone adds weight to the idea of accumulation, especially when contrasted with historical cycles.
Technical View: Compression Signals Next Move
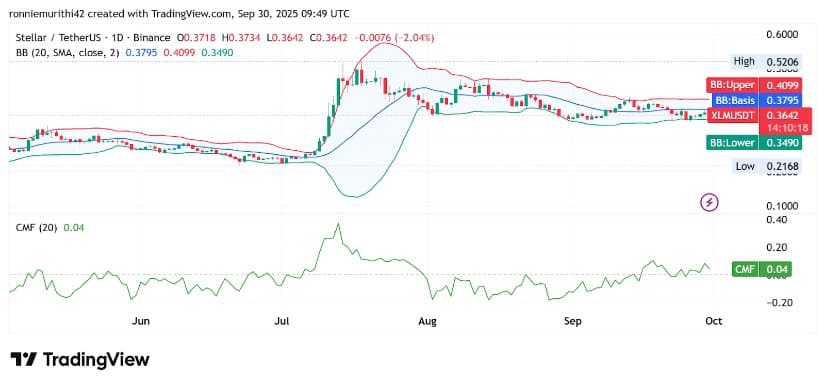
The daily chart of XLM/USDT on TradingView shows the price currently trading at $0.3661, just below the Bollinger Band midline at $0.3796. The upper band sits near $0.4098, while the lower band holds at $0.3493. The narrowing bands reflect a period of reduced volatility, often preceding a stronger directional move.
Source: TradingView
Historically, prolonged compressions of Bollinger Bands have acted as precursors to significant price shifts. If the token manages to close above the basis line at $0.38, it could set the stage for a push toward the $0.41 resistance, with higher targets in play if volume accelerates. Conversely, failure to hold the lower band near $0.35 may expose the token to downside risk toward deeper support levels.
The Chaikin Money Flow (CMF) indicator currently reads +0.05, pointing to modest capital inflows. This suggests that despite subdued price action, buying pressure has not disappeared. A sustained positive CMF reading would add confidence to the bullish case, signaling that accumulation is indeed taking place beneath the surface.

