The broader crypto market remains under intense pressure, extending the correction that began earlier this month. As of November 7, 2025, total market capitalization sits around $3.34 trillion, down sharply from recent highs. Daily trading volume hovers at $162 billion, showing continued activity but limited buying confidence.
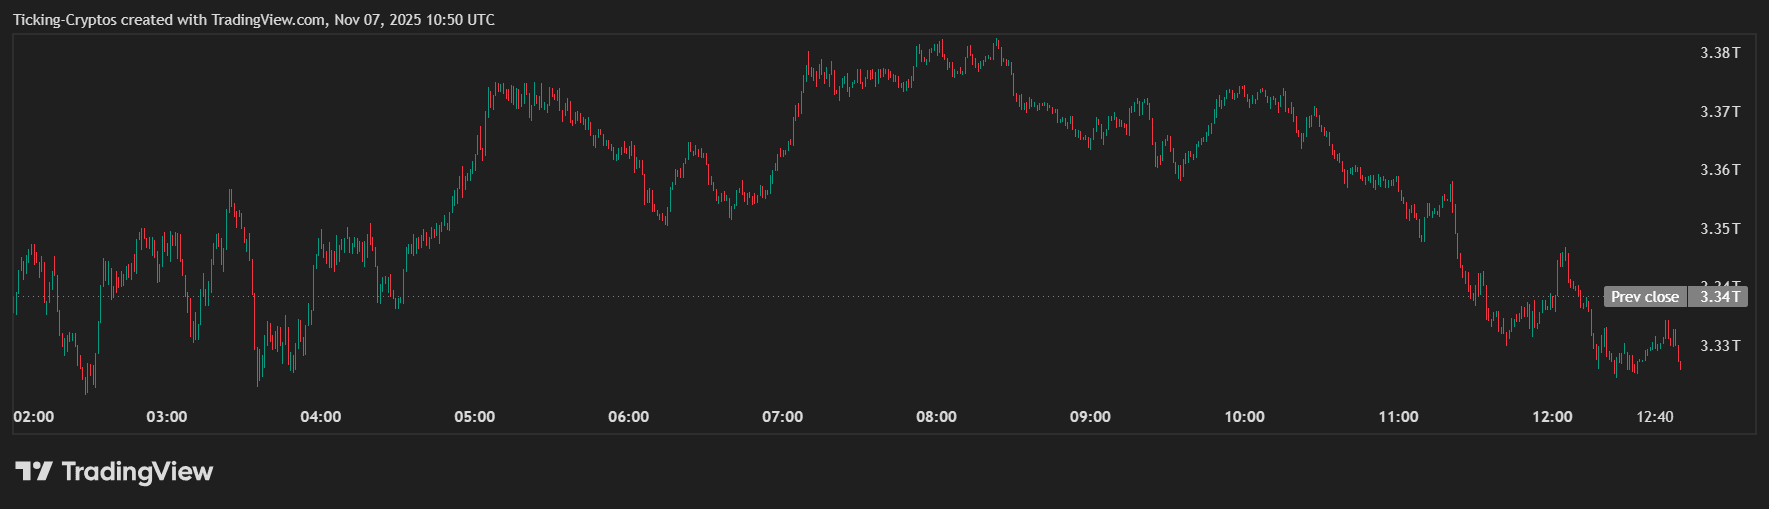
Total market cap in USD - TradingView
$Bitcoin trades near $100,780, down 2.38% in 24 hours and over 8% this week. $Ethereum follows with a 3.4% daily drop, while $Solana and $XRP lead losses among top altcoins, falling over 17% and 12% respectively in the past seven days.
The attached Bitcoin chart shows a clear breakdown below major support zones. $BTC has fallen beneath both its 9-day and 21-day moving averages, with short-term resistance now sitting around $105,800 to $106,000. The 200-day SMA at $110,195 has turned into a critical barrier that Bitcoin failed to reclaim.
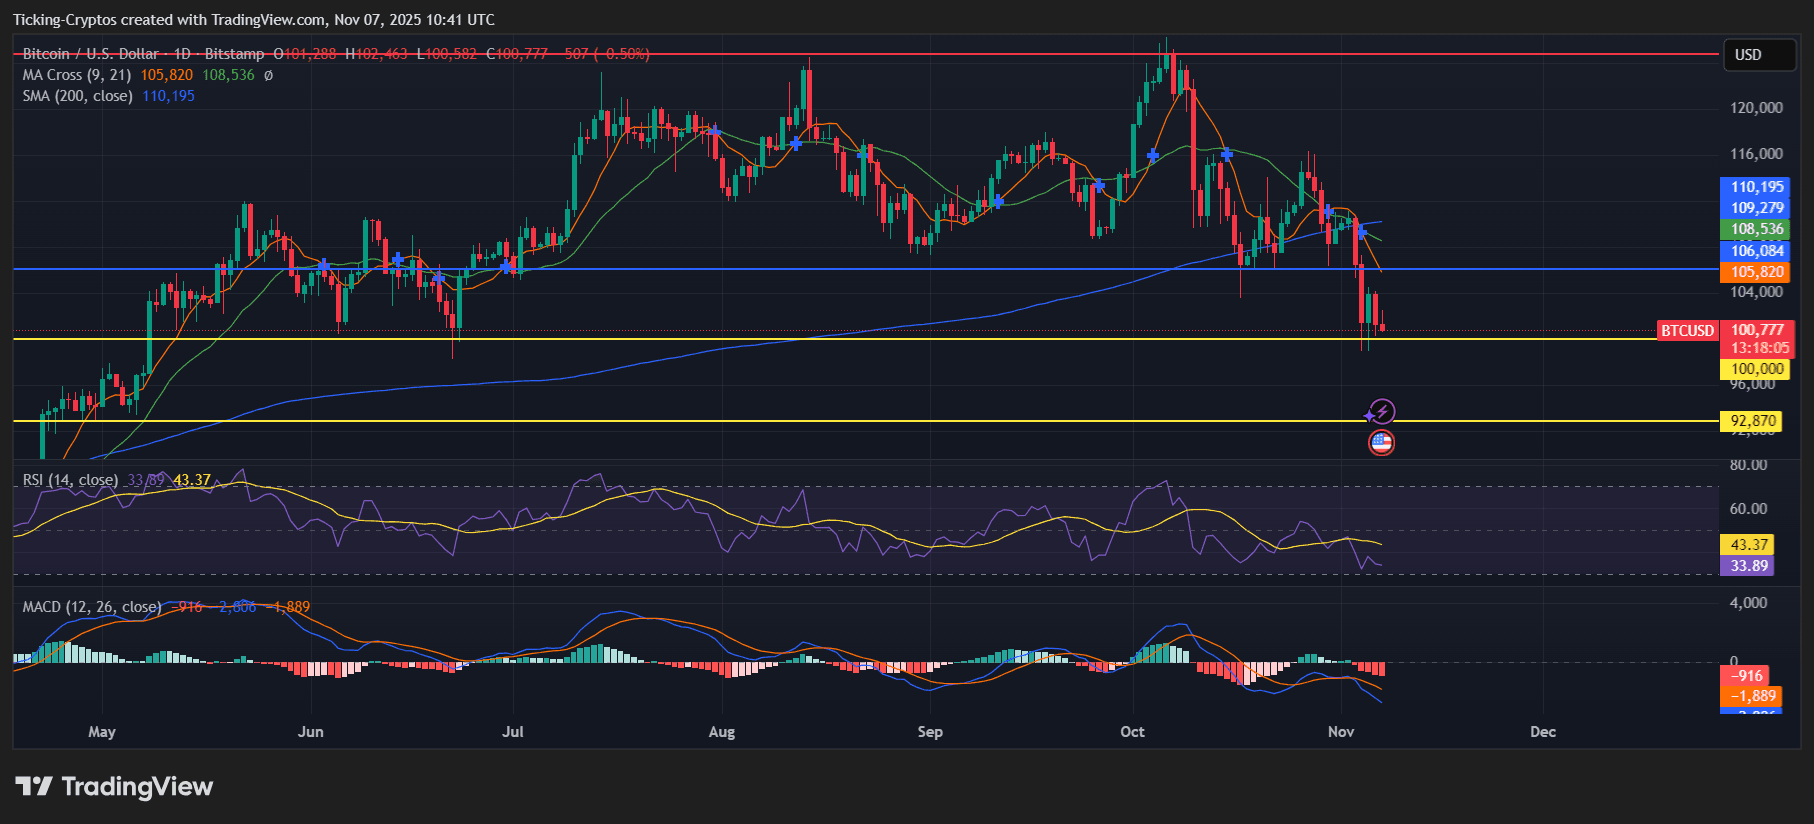
BTC/USD 1-day chart - TradingView
The RSI has dropped to 43, showing weakening momentum and suggesting that selling pressure remains dominant. Meanwhile, the MACD indicator confirms a bearish crossover, with widening histogram bars pointing to further downside potential.
Unless BTC quickly rebounds above $106K, traders may expect extended selling toward the psychological $100,000 level, which is currently acting as temporary support.
Analysts across the market warn that the next key support lies near $92,870, followed by $90,000, where strong buying interest might emerge. If Bitcoin fails to stabilize there, the market could see deeper losses into the mid-$80K range, especially if macroeconomic sentiment or ETF outflows worsen.
The broader narrative remains bearish until Bitcoin forms a confirmed reversal pattern. For now, traders are watching how long BTC can defend the $100K level before capitulation drives it to new cycle lows.

