The crypto market surprised traders with a sharp overnight rebound. $Bitcoin staged a powerful reversal from its liquidity-driven sell-off, flipping the entire market green while major macro signals hit global markets.
From whale-driven stop hunts to a sudden rotation out of gold and back into Bitcoin, the landscape shifted fast — and retail traders were once again caught off guard.
Here’s a breakdown of what happened and why the charts look completely different this morning.
The first catalyst behind the volatility wasn’t news — it was liquidity manipulation.
A sharp drop hit Bitcoin during fears around Japan’s yield decisions, triggering:
This followed the typical whale pattern:
Minutes after the sweep, Bloomberg reported that Vanguard may allow clients to buy crypto ETFs — a headline perfectly timed with Bitcoin’s rebound. Retail lost; smart money won.
A few hours later, traders woke up to a major macro shift: President Trump has selected Kevin Hassett as the new Federal Reserve Chair.
This instantly reshaped market expectations:
Crypto tends to thrive when monetary policy loosens — and the charts reacted accordingly.
Bitcoin surged as traders priced in a more accommodative Fed path.
Another key signal appeared in the charts:
Gold sold off sharply while Bitcoin accelerated upward.
This is a classic risk rotation:
Historically, gold outflows into Bitcoin have preceded major BTC rallies — and this pattern is repeating.
BTC’s V-shaped recovery shows clear strength from larger players.
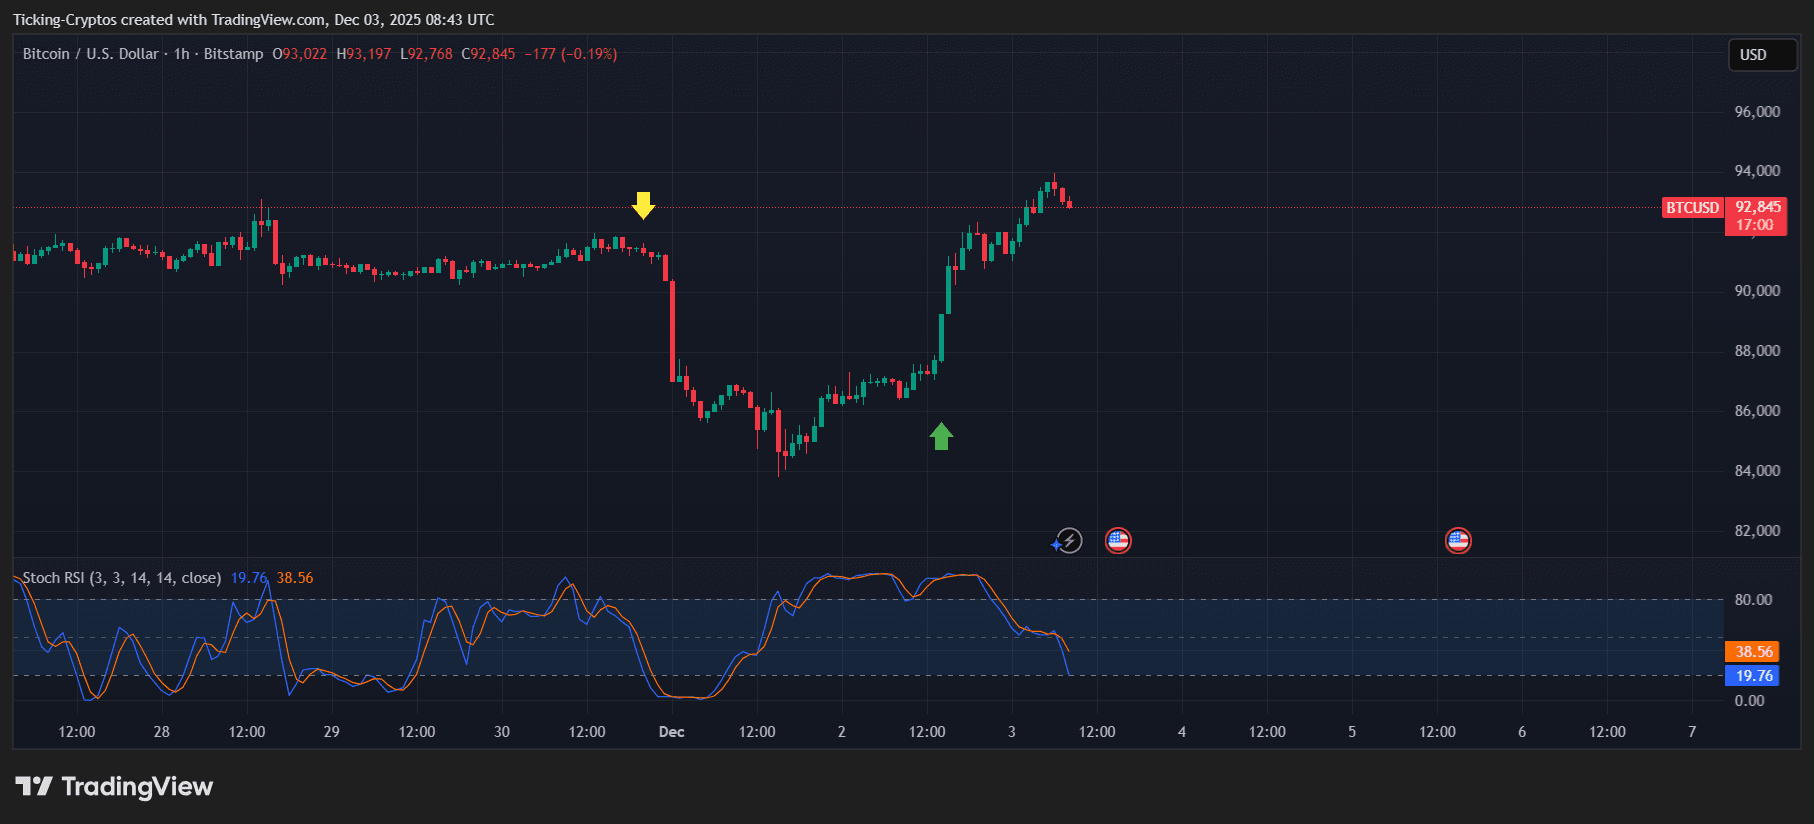
BTC/USD 1-hour chart - TradingView
Here’s what the chart is signaling:
If momentum holds, the next likely upside targets are:
🔼 $95,000
🔼 $98,500
🔼 $102,000 (psychological level)
Downside zones remain:
🔻 $88,000
🔻 $85,000
Short-term conditions now favor continuation.

