The cryptocurrency market is facing a wave of selling pressure, and Bitcoin has not been spared. In the last few hours, the world’s largest digital asset slipped below the $115,000 level, signaling that bullish momentum has weakened. The break under this critical threshold reflects a broader loss of control by buyers as volatility sweeps through global markets following heightened liquidations and risk-off sentiment.
Despite the setback, on-chain data reveals an important dimension of Bitcoin’s current state. Top analyst Axel Adler highlighted that Bitcoin long-term holders (LTHs) are sitting on $1.18 trillion in unrealized profit. This staggering figure underscores the extent of accumulation in previous months and the resilience of long-term investors, even as short-term price action remains shaky.
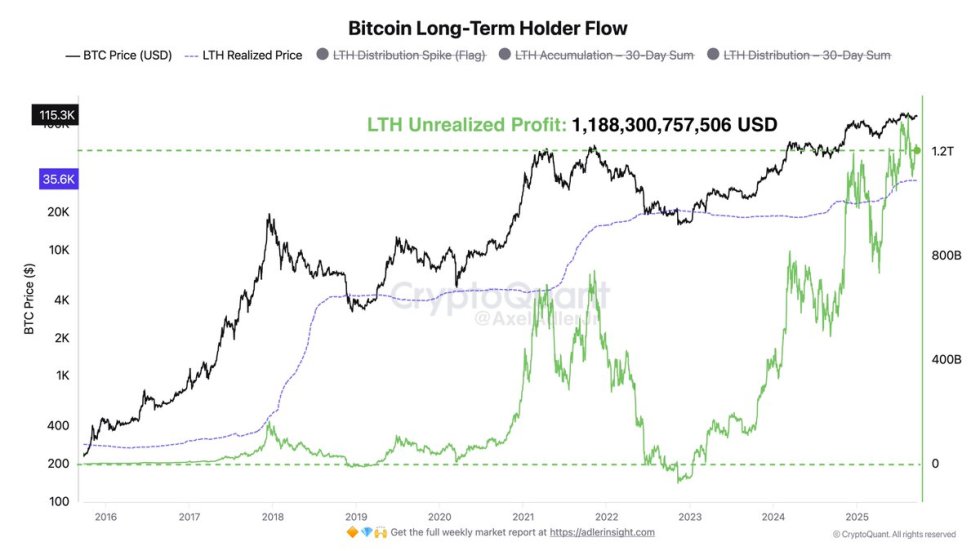
Historically, when LTHs hold such substantial profits, the market reaches pivotal points where profit-taking pressure competes with fresh demand. While some traders view this as a risk of increased selling, others interpret it as proof of Bitcoin’s strong fundamentals, with deep-pocketed holders continuing to maintain conviction.
When LTHs maintain such significant paper gains, it reflects the depth of conviction among investors who acquired Bitcoin during earlier phases of the cycle. Historically, these periods of elevated unrealized profit create both opportunity and risk: on one side, they demonstrate the asset’s resilience and potential for further growth, while on the other, they heighten the risk of profit-taking that could pressure prices.
According to on-chain data, LTHs are not uniformly selling into strength. Instead, many continue to hold, signaling confidence in Bitcoin’s long-term trajectory. This willingness to remain invested even amid volatility provides a stabilizing foundation for the market. However, when large tranches of older coins begin to move, as seen in recent weeks, price reactions often follow swiftly, reflecting the influence of these cohorts.
The recent 25-bps interest rate cut by the Federal Reserve has introduced another layer of complexity. While monetary easing typically supports risk assets like Bitcoin, it also injects volatility as markets recalibrate to the new macro environment. This “new phase” could extend the cycle, but it will likely be driven by sharp swings as speculative capital tests supply levels against LTH conviction.
Bitcoin has come under heavy pressure after failing to hold above the $115K level, as shown in the chart. The drop pushed BTC down to nearly $112K, marking one of its sharpest daily declines in recent weeks. This correction follows the recent post-Fed rally, highlighting the market’s volatility as traders reassess their positions.
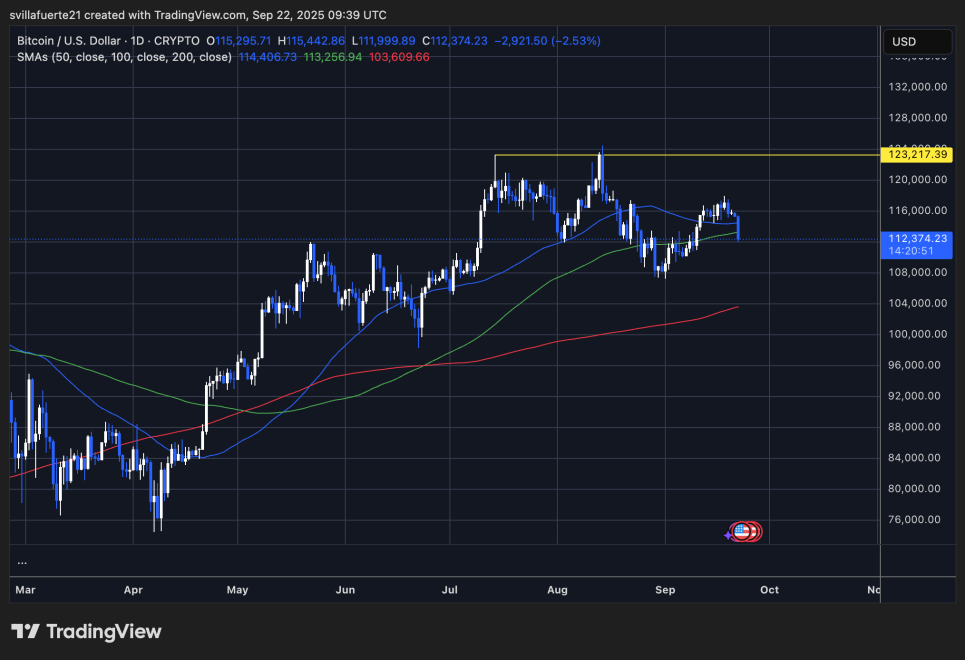
From a technical perspective, BTC has broken below its short-term support levels, signaling weakening bullish momentum. The daily chart shows the price dipping beneath the 50-day moving average around $114.4K, an area that had acted as support during the September rebound. If bulls fail to reclaim this level, further downside could test the $110K region, where the 100-day moving average currently lies.
Resistance remains at $123K, a key level marked by the August high. A decisive move above that zone would confirm renewed bullish strength and open the door toward fresh all-time highs. Until then, the structure suggests consolidation with downside risk.
Bitcoin’s pullback reflects profit-taking and pressure from recent whale and long-term holder activity. With volatility rising, the next sessions will be critical in determining whether BTC stabilizes above $110K or risks deeper retracement before attempting another breakout.
Featured image from Dall-E, chart from TradingView


