
The key catalyst for the Australian dollar remains the July inflation data released on 26 August. The figure came in at 3.5% year-on-year, versus expectations of 3.2%, while the Trimmed Mean increased by 0.5% month-on-month, compared with a forecast of 0.3%. The following day, 27 August, NAB revised its forecast for the RBA’s next policy decision. The bank now expects a 25-basis-point rate hike at the September meeting, taking the rate to 4.6%, with the risk of another increase in November.
For the Canadian dollar, the key factor was the Bank of Canada’s decision. On 2 September, the central bank left its policy rate unchanged at 2.25% for the seventh consecutive meeting, highlighting economic uncertainty stemming from US tariffs and Canada’s retaliatory trade measures.
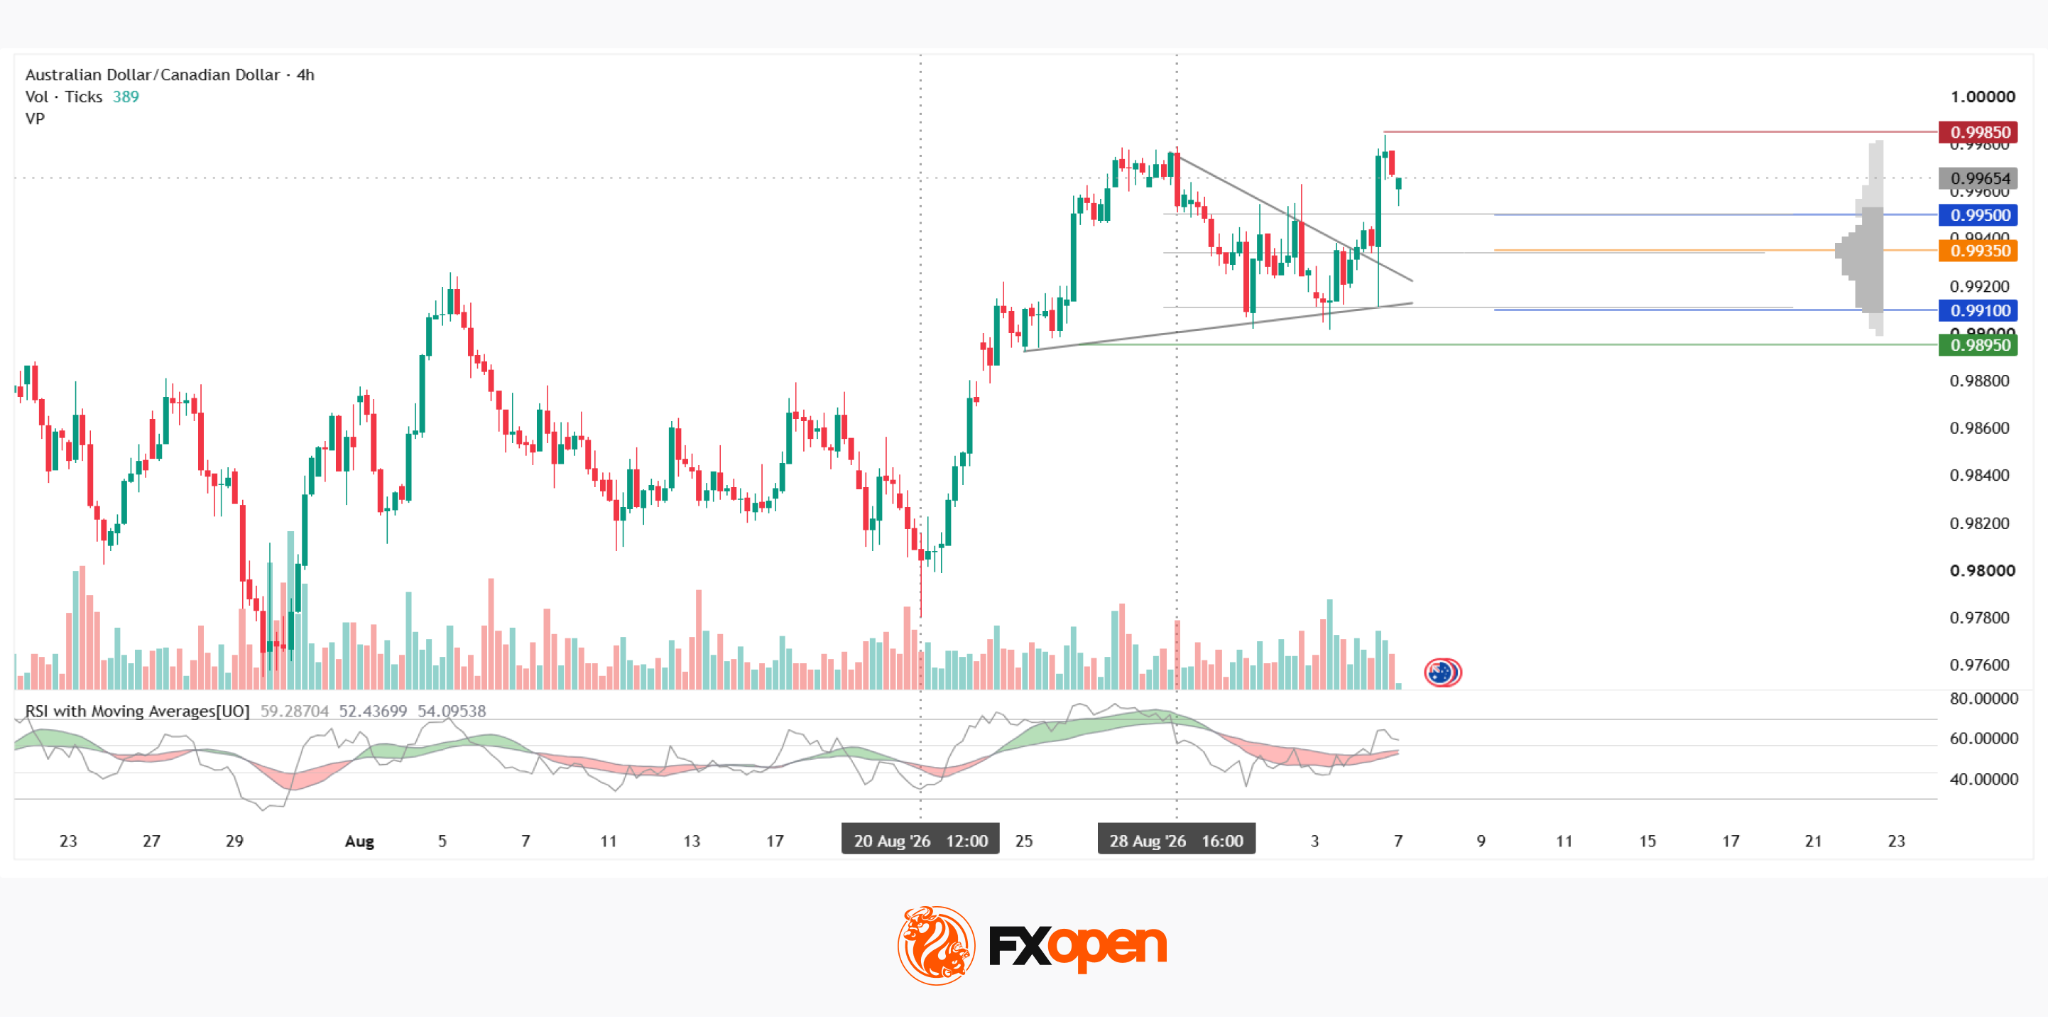
The four-hour AUD/CAD chart shows a pronounced uptrend that has lifted the pair towards the current resistance level at 0.9985. A pattern resembling a converging triangle formed near the top of this advance, with price fluctuations gradually narrowing within the formation. However, volume dynamics during the second half of the pattern’s formation have been atypical, casting doubt on its reliability.
Nevertheless, the price has broken out of the pattern while also moving above the upper boundary of the current market profile at 0.9950, and is attempting to establish itself above this level. If the advance continues, the red resistance level around 0.9985 is the next key obstacle on the upside.
In the event of a false breakout, the price could return to the profile. If the scenario turns bearish, the pair would need to break not only the upper boundary of the profile but also the Point of Control (POC) at 0.9935 and the lower boundary at 0.9910. Below the market density, a green support level is located around 0.9895.
The RSI + MAs indicator is showing readings of 59, 52 and 54. The RSI has moved above the neutral zone, while both the fast and slow moving averages remain below its upper boundary.
The atypical volume dynamics during the formation of the triangle leave the reliability of the breakout uncertain, while the price’s attempt to establish itself above the market profile has yet to receive confirmation from the RSI + MAs indicator. The pair’s further direction could depend largely on whether the expected tightening of RBA policy materialises against the backdrop of the Bank of Canada’s wait-and-see stance.





