
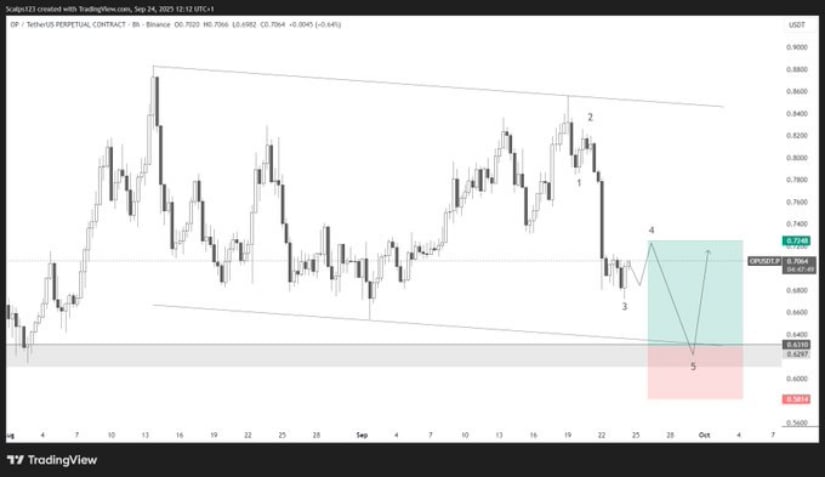
The latest correction appears to be completing a five-wave structure, with analyst Rami Scalps identifying an ideal long entry at $0.6297, protected by a stop loss at $0.5814 and targeting $0.7248.
Optimism has caught the attention of market watchers after completing a sharp corrective move within a descending channel. Analyst Rami Scalps has mapped out a bullish scenario, calling for a long entry at $0.6297, with a stop loss at $0.5814 and a target of $0.7248.
The fifth wave of the corrective structure is unfolding, and traders are closely monitoring the channel support and order block zone for confirmation of a reversal.
Source: X
Adding to the bullish case, whale wallets have reportedly been accumulating the crypto throughout the dip, suggesting growing confidence that the current price zone represents value.
This smart money behavior has historically preceded rallies, reinforcing the potential for the token to bounce toward the upper channel and retest resistance around $0.72–$0.74 in the near term.
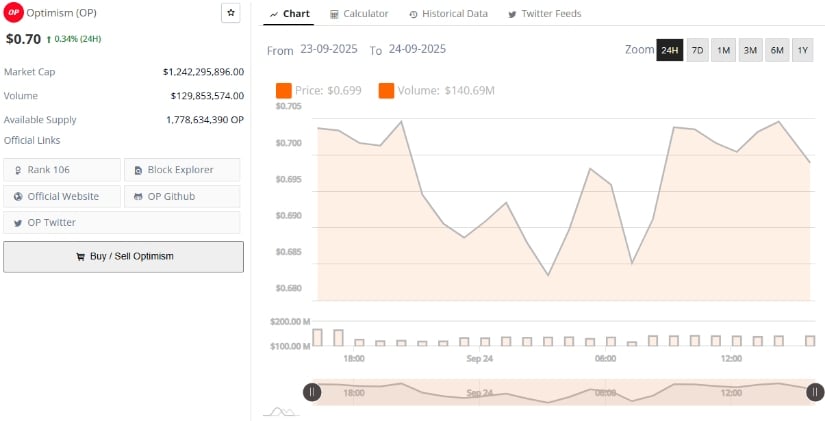
On one hand, from a market data perspective, OP is trading at $0.707, up 3.6% in the last 24 hours. The token maintains a healthy $1.24 billion market cap and sees strong daily turnover with $129 million in volume, signaling that liquidity remains robust despite recent selling pressure.
Buyers stepping in at the $0.62–$0.64 support zone are helping stabilize the price action, making this area a critical line in the sand for bulls.
Source: BraveNewCoin
The token’s long-term resilience can be seen in how volume surges align with dips, highlighting consistent demand at lower price points. This ongoing accumulation aligns with the broader narrative of whales quietly stacking, further strengthening the likelihood of a bullish reversal forming in the short to mid-term.
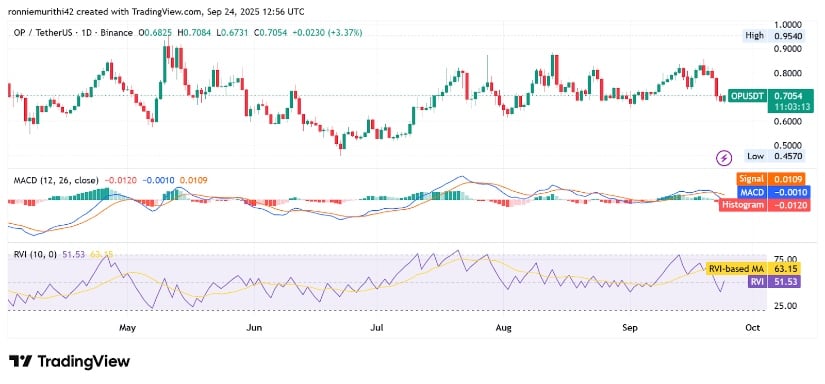
On the other hand, the daily chart reflects a tug of war between bulls and bears. The MACD shows bearish momentum fading, with the histogram approaching neutral levels — a sign that sellers may be losing steam.
Meanwhile, the Relative Vigor Index (RVI) hovers around 51.49, nearly in line with its moving average of 63.15, suggesting indecision but also laying the groundwork for a potential bullish crossover if buying momentum intensifies.
Source: TradingView
Holding above the $0.62 support zone remains key. If buyers defend this base and volume continues to rise, OP could push toward its target of $0.7248, representing a 15% upside. Conversely, losing this support would flip the script, exposing the token to a deeper pullback toward $0.58, the last strong demand area.
For now, the balance of signals leans cautiously bullish, with whale accumulation acting as a quiet tailwind for the recovery narrative.


