
The post Ethereum Price Prediction: Is ETH Preparing for a Massive Breakout in May? appeared first on Coinpedia Fintech News
After rebounding from local lows near $2,275, the Ethereum price climbed above $2,375 and is currently consolidating within a narrow range. While the broader crypto market has turned bullish with the Bitcoin price reclaiming levels above $82,000, ETH continues to trade below a crucial resistance zone near $2,400. Despite the consolidation, both on-chain and derivatives data suggest growing market strength, reinforcing the bullish outlook for Ethereum.
ETH is currently trading around $2,326, while trading volume has surged by more than 103%, signaling rising trader participation and renewed market interest. Increasing open interest, stable network activity, and growing ETH staking levels further indicate that Ethereum may be entering a strong accumulation phase ahead of a larger move.
Although the Ethereum price still faces strong resistance near $2,400–$2,500, the broader market structure suggests the token could be preparing for its next major rally. If buyers manage to push ETH above these key levels, bullish momentum may accelerate, reviving hopes of a recovery toward the $3,000 milestone in the coming weeks.
The Ethereum price continues to consolidate near the $2,300 range after recovering strongly from the local lows formed earlier this year. While ETH remains below a crucial resistance zone near $2,400, the latest derivatives data suggests traders are gradually positioning for a larger move ahead. Rising open interest and improving funding rates indicate that bullish sentiment is slowly returning to the Ethereum market despite the ongoing consolidation.
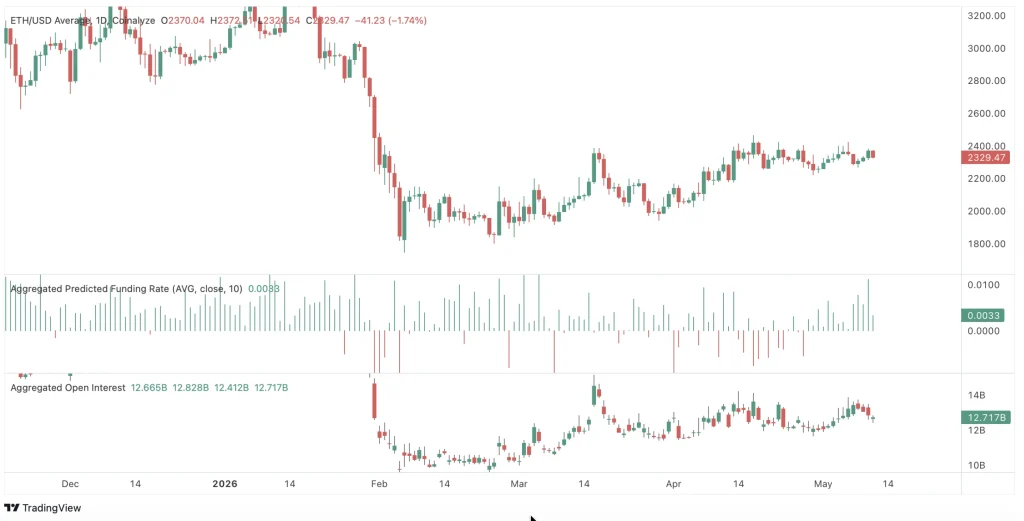
As seen in the chart above, Ethereum’s Aggregated Open Interest has recovered steadily from the February lows and is currently holding above $12.7 billion. This rise in open interest alongside stable price action suggests that traders are opening fresh positions instead of closing them, often signaling expectations of increased volatility and a potential breakout.
At the same time, the Aggregated Funding Rate has turned positive again, indicating that long-position traders are willing to pay premiums to maintain bullish exposure. More importantly, the funding rates are not excessively overheated yet, which suggests the market is witnessing healthy bullish positioning rather than speculative euphoria. Collectively, the chart points toward growing confidence among derivative traders.
Despite trading below a crucial resistance zone near $2,400, Ethereum continues to display strong underlying fundamentals across both on-chain and market activity. Metrics like active addresses, taker buy/sell ratio, and ETH staking levels suggest the market may be undergoing a strong accumulation phase instead of a bearish distribution phase. Here’s what the latest charts reveal about Ethereum’s current market structure.
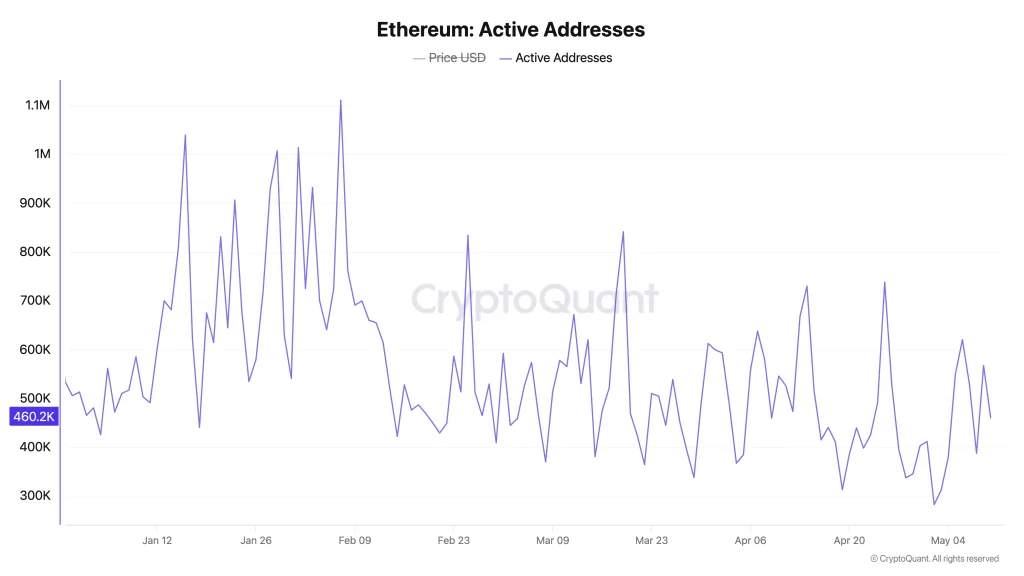
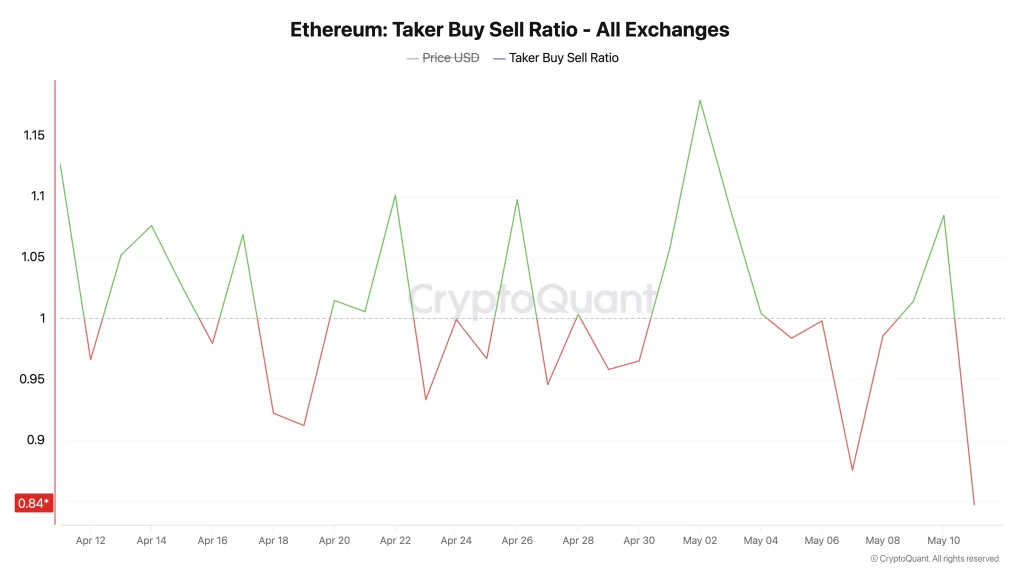
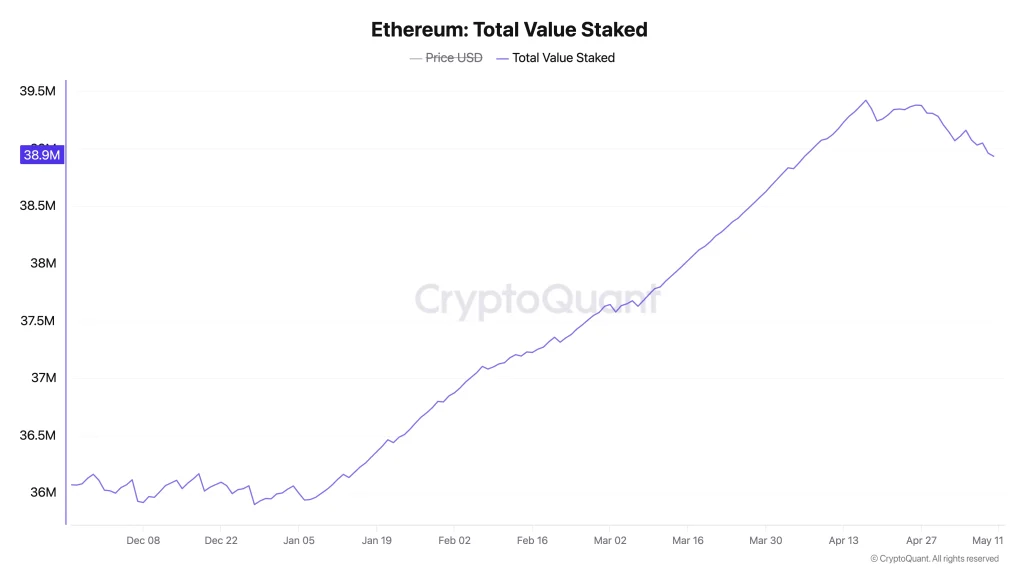
Collectively, the charts suggest Ethereum is currently in an accumulation and positioning phase rather than a speculative rally phase. While short-term momentum remains cautious, the combination of stable network activity, rising staking levels, and improving derivatives positioning points toward strengthening long-term bullish sentiment.
Ethereum continues to hold a bullish market structure despite consolidating below the key $2,400 resistance zone. Rising open interest, positive funding rates, stable network activity, and increasing ETH staking suggest the market is in an accumulation phase rather than a bearish reversal.
A breakout above the $2,400–$2,500 range could trigger fresh bullish momentum, pushing the ETH price toward $2,700 and potentially reviving the path toward $3,000. However, failure to clear the resistance may keep Ethereum range-bound and increase the risk of a short-term pullback toward $2,200 before the next major move.

