
The price has remained stable near $0.000071, and technical setups from multiple sources indicate a potential breakout scenario forming if market conditions align favorably in the short term.
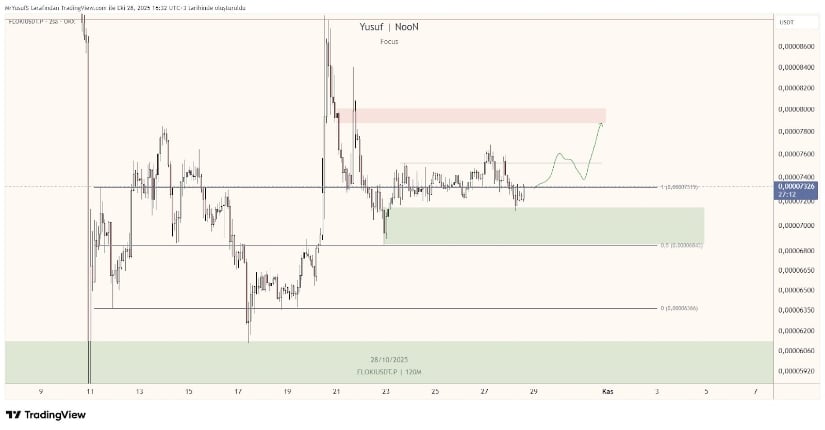
In a recent analysis shared on X, technical observers noted that the FLOKI/USDT pair on the 120-minute chart is hovering slightly above a critical support zone around $0.00007000. The chart features a green-shaded area marking this level as a probable buy zone, reinforced by the 0.5 Fibonacci retracement at $0.00006843. The resistance area, meanwhile, sits near $0.00007800–$0.00008000, forming a clear range for price action in the short term.
Source: X
The analyst illustrated a curved green trajectory, forecasting a potential rebound from the support region. This setup implies that after mild sideways action, the token could attempt a breakout through the upper boundary of the consolidation channel. The presence of strong volume reactions near the green zone further supports the case for a bullish bounce, signaling accumulation by large holders or short-term swing buyers.
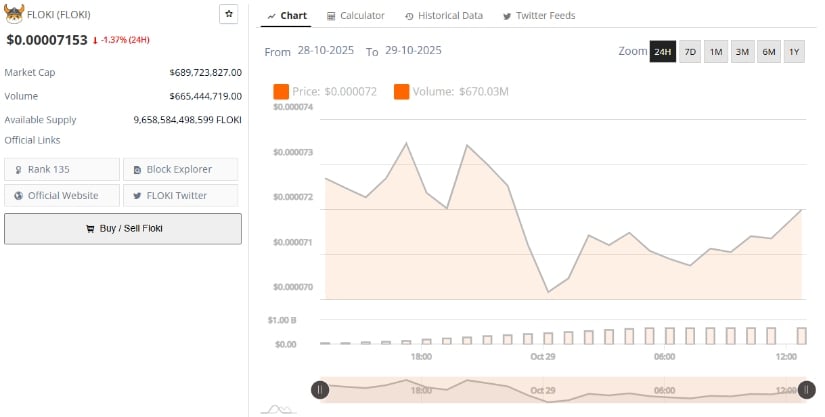
On one hand, data from BraveNewCoin, FLOKI is trading at $0.00007153, marking a 1.37% daily decline. The asset’s market capitalization stands at $689.72 million, supported by a 24-hour trading volume of $665.44 million, and an available supply of 9.65 trillion tokens. The coin currently ranks #135 globally by market capitalization, underscoring its solid liquidity despite the recent cooling in price volatility.
Source: BraveNewCoin
The data suggests the token is maintaining consistent participation levels even amid short-term corrections. The narrow trading range between $0.00007000 and $0.00007300 aligns with the consolidation phase highlighted by analysts, indicating that accumulation is likely taking place. The price’s proximity to the mid-range Fibonacci level reinforces the structural support, hinting that downside risks may be contained unless broader market sentiment weakens.
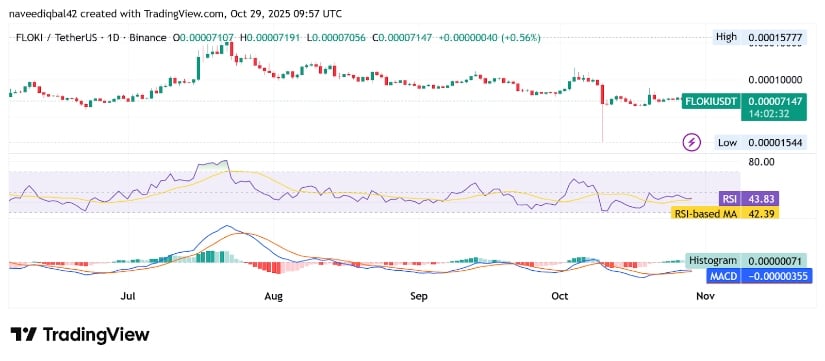
At the time of writing, TradingView data places FLOKI/USDT at $0.00007148, slightly above its immediate support. The daily chart shows a prolonged consolidation following the previous bullish rally, with prices significantly below the summer peak of $0.00015777. This indicates that while buyers have cooled off, market participants are waiting for confirmation before initiating new positions.
Source: TradingView
The Relative Strength Index (RSI) is at 43.84, slightly above its moving average of 42.39, signaling a neutral to mildly bullish tone. The MACD histogram displays a small positive reading (0.00000071), although the MACD line remains slightly negative (–0.00000355), suggesting that momentum is in transition. These metrics reflect a balanced tug-of-war between bulls and bears, with neither side showing strong dominance.

