
The rally has caught the attention of traders who are watching for a breakout toward the $12 range, with the asset building momentum on both technical and fundamental strength.
In a recent X post, analyst X Finance Bull highlighted how conviction and data-driven analysis led to catching the bottom in Uniswap’s price action. The analyst noted that buying at the lows has already returned over 100%, proving once again that DeFi’s real strength lies in execution rather than theory. The crypto, as a core engine of decentralized finance, has demonstrated resilience through market volatility.
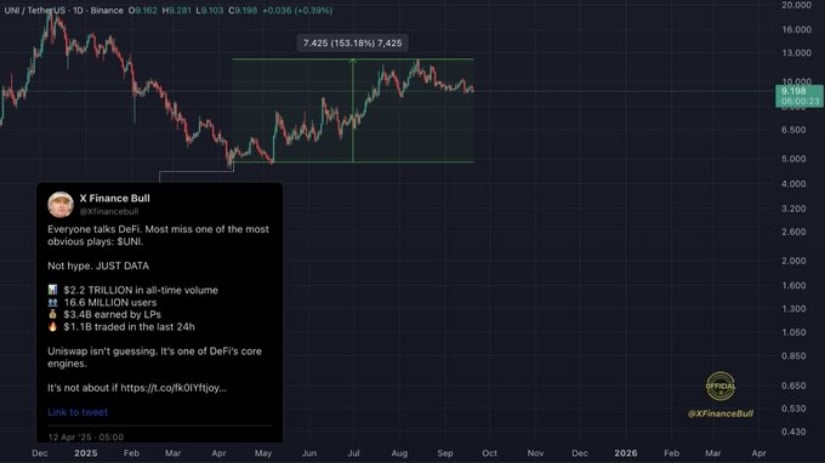
Source: X
The first chart shows the token bouncing sharply off its lows and holding a strong consolidation range between $7 and $13. That 153% rally from the bottom suggests significant demand buildup and renewed investor confidence in the memecoin’s role in powering DeFi infrastructure. X Finance Bull emphasizes this as not hype but a simple observation of liquidity and volume flows.
For traders and long-term holders, this bottom call reinforces the value of disciplined conviction in the market. By identifying accumulation zones and sticking to fundamentals, the coin rebound demonstrates how smart positioning can generate outsized returns when the broader sector regains traction.
In supporting the analyst’s views, fresh data from BraveNewCoin provides strong fundamentals. Uniswap currently trades at $9.19 with a market cap of $5.51 billion, ranking #38 among crypto assets. Daily trading volume sits at $170M+, reflecting ongoing market participation and liquidity despite price consolidation.
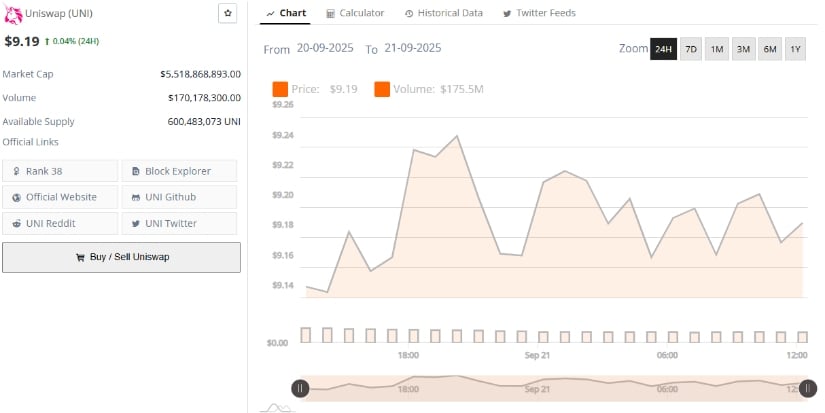
Source: BraveNewCoin
The supply dynamics are also clear — 600 million tokens are in circulation, ensuring transparent tokenomics. Unlike speculative projects, the token backs these figures with proven on-chain activity, processing billions in volume across DeFi markets. These hard numbers reinforce the notion that the asset is not just a narrative play but an operational backbone in decentralized finance.
At the time of writing, the coin was trading at $9.19 according to TradingView data. Recent price action shows UNI pulling back from highs near $12.30, with support forming around the $9 level. MACD readings (-0.030) indicate a slight bearish crossover, while the histogram remains close to neutral, suggesting reduced momentum.
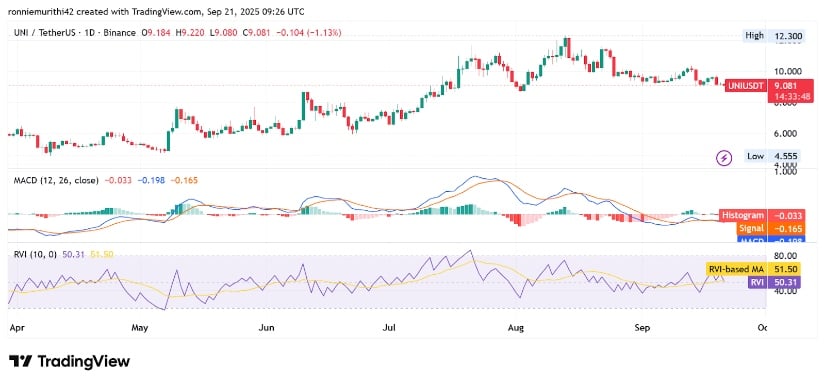
Source: TradingView
The Relative Vigor Index (RVI) also hovers around 50.4, signaling indecision as bulls and bears battle for short-term control. Price remains above the key low of $4.55, maintaining a strong higher-low structure that keeps the broader uptrend intact. Consolidation around current levels may serve as a healthy reset before another push higher.
If the asset holds above $9, it could provide a launchpad for a retest of resistance in the $11–$12 range. Conversely, a breakdown below this level may invite further correction toward $7.50, where strong buying previously emerged. Overall, the technicals suggest the crypto is in a cooling period, building the base for its next significant move.


