
The rally has positioned the token among the day’s top performers, with trading activity showing sharp increases across exchanges. At present, the token is consolidating around $0.28, which has now turned into an important support level.
In a recent X post, @DyorNetCrypto highlighted the coin breakout from a falling wedge formation, a technical signal often linked to bullish reversals. The move was confirmed by trading volume exceeding $120 million, a sign of strong participation from both institutional and retail players. This level of activity provided the momentum needed for the memecoin to push through resistance levels.
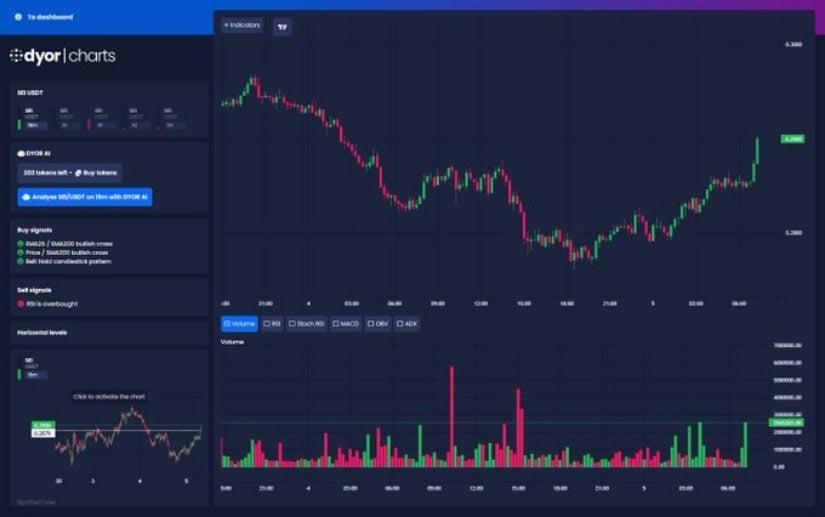
Source: X
Market watchers also noted significant SEI whale activity, as large holders moved substantial amounts during the rally. These transactions added liquidity and helped maintain price strength through the breakout. Technical indicators further support the bullish case, with the RSI remaining in overbought territory and the MACD showing a clear upward crossover.
The short-term trend is being reinforced by the asset’s ability to hold above previous resistance points, effectively turning them into new support levels for price stability. With a market capitalization of about $1.70 billion, the token has established itself as a well-supported asset. While the all-time high of $1.14 remains far ahead, current levels indicate steady progress, supported by both technical indicators and investor interest.
Additionally, recent data from BraveNewCoin supports the analyst’s view that SEI is entering a consolidation phase after a period of heightened volatility. The token’s 24-hour trading volume stands near $120 million, with a market capitalization of about $1.72 billion, ranking it around #77 among cryptocurrencies. The current price is steady at $0.2851, moving within a daily range between $0.2767 and $0.2884, signaling stability in market activity.
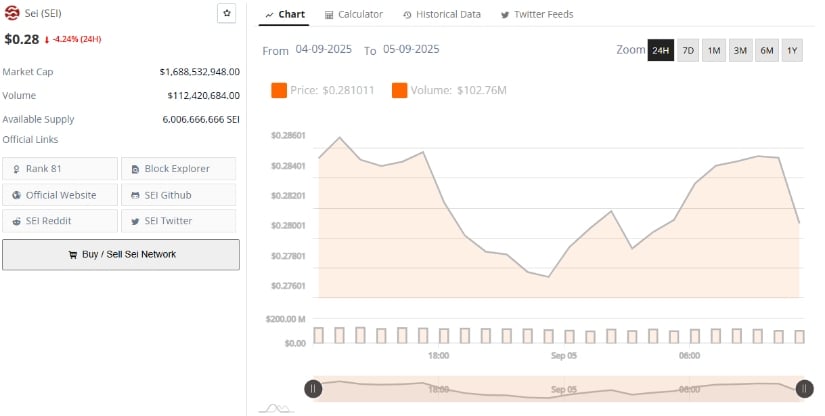
Source: BraveNewCoin
The chart reveals the coin trading in a defined channel, with support at $0.27 and resistance at $0.37. Recent touches at the lower boundary show strong defense from buyers, often considered a positive sign that accumulation is underway.
Moving averages highlight the mixed outlook: the 50-day SMA sits at $0.3182, while the 200-day SMA holds at $0.2425, creating a setup where long-term stability underpins the price, even as short-term pressure limits upward movement.
On the other hand, at the time of writing, the coin was trading at approximately $0.2851. Analysis of the TradingView chart shows the token moving within a narrow range, as highlighted by the Bollinger Bands. The bands appear to be contracting, a sign of low volatility and consolidation following the recent surge. Price action near the middle band reflects a neutral stance, with neither buyers nor sellers firmly in control.
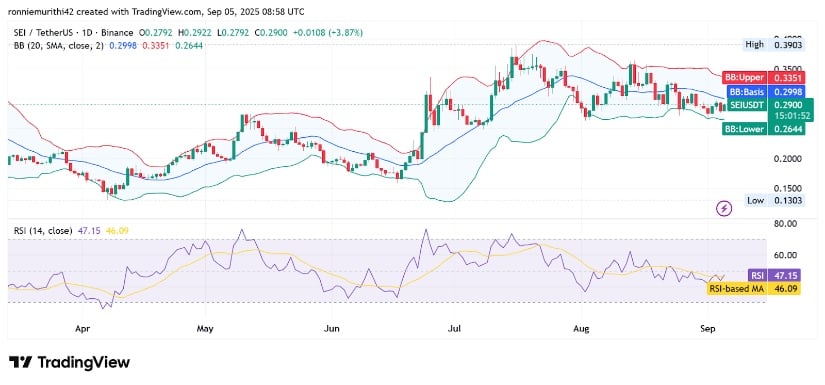
Source: TradingView
The Relative Strength Index (RSI) is holding close to the neutral zone at around 45, further supporting this balanced outlook. This level indicates that momentum is evenly split, with no clear advantage to bulls or bears. In technical terms, such conditions often mark accumulation phases, where the market is preparing for its next move. For the token, a decisive shift in RSI toward overbought or oversold levels would be required to confirm a new trend.
The presence of SEI whales adds weight to this phase of stability. Their activity around key support levels suggests steady accumulation, helping prevent a price breakdown. The token’s position around $0.2851 has therefore become a focal point, where whale influence, technical indicators, and market sentiment converge.

