
The Sandbox (SAND) 4H chart shows a bullish setup forming, with each fall having a higher low. As of March 14, 2026, the SAND price is approximately $0.0845.
Nearby, a clean 4H Order Block Demand Zone exists around the $0.0830 area, which aligns with the 0.5 Fibonacci retracement.
Traders are watching the pullback in the price to the $0.0830 price order block, where they are considering going long, and their stop loss is just below the recent price zone at $0.0805.

The liquidity is found above the recent price highs, and the price could be pulled up due to the recent price action in the order block.
If demand steps in and responds positively, the initial target lies at $0.0874, where the buying side of the liquidity tends to be, according to Crypto Analyst Crypto Patel.
A stronger response could see the price move towards the external side of the liquidity, priced at $0.0894, completing the bullish pattern as seen on the chart.
Also Read: Sandbox (SAND) Tests Key Support Zone After Prolonged 99% Decline
From a technical perspective, SAND fluctuates between $0.082 after a sharp decline, where it appears to be in a tight range.
The key resistance levels are at $0.085, $0.088, and $0.095, followed by stronger levels at $0.10, $0.105, and even the key Ichimoku cloud resistance levels at $0.123-$0.125.

The support is building at the vicinity of $0.080, with stronger support at $0.077, $0.072, and $0.065 if the selling pressure increases.
A breakout above $0.088 could propel the price to higher targets, whereas a drop below $0.080 could lead to another bearish move to the lower support levels.
From an indicator’s point of view, the RSI indicator currently sits at 45.94, which indicates that momentum is improving with the appearance of a bullish divergence.
Although the price has continued to make lower lows, the RSI has continued to make higher lows, which indicates that selling pressure is diminishing. If momentum strengthens, it could rise to 50-55, then 60. It could fall to 40 and 35 if bearish pressure resumes.
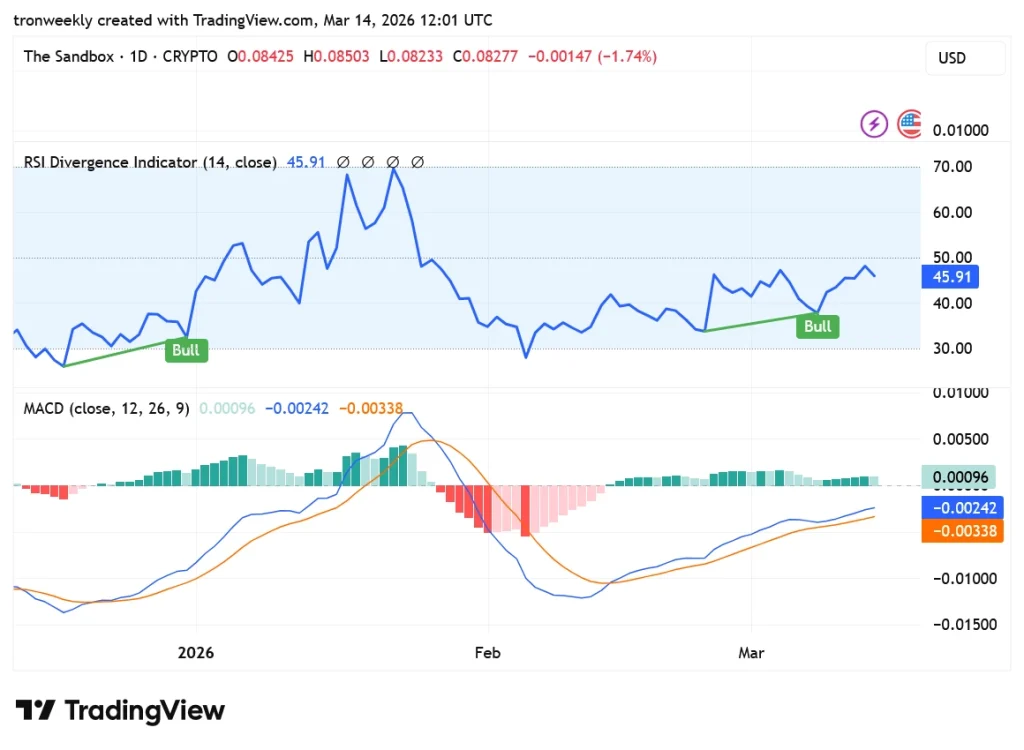
The MACD is indicating a developing recovery as the line is currently at -0.00242 and is moving closer to the signal line, which is at -0.00338. The histogram is moving into positive territory, indicating a rise of about 0.00096.
This is an indication of increasing bullish pressure. The crossover could be aiming for a rise of between 0.002 and 0.004, or a fall back down to -0.005 and -0.01 in the event of a rejection.
Market players should watch the price action at the $0.0830 price level, where a confirmed price bounce could generate short-term bullish price action towards the $0.0874-$0.0894 price range.
As the RSI and MACD indicators are showing rising buying pressure, market players can look to position themselves accordingly.
This article contains market analysis and price predictions. These are not guarantees. Crypto markets are volatile. Always DYOR. Not financial advice.
Also Read: The Sandbox (SAND) Poised for Explosive Move Toward $2.60

