
The second half of August proved a testing time for cryptocurrency enthusiasts. After hitting a record peak of around $124k on 14 August, the BTC/USD rate fell by roughly 13% by the end of the month.
Several factors may have contributed to this decline, including the perception of cryptocurrencies as a risky asset:
→ The US economy showed worrying signs of stagflation (slowing job growth combined with persistent core inflation).
→ Media commentary suggested the market was overheated, with hints of a bubble forming amid the hype surrounding AI.
Technical Analysis of BTC/USD
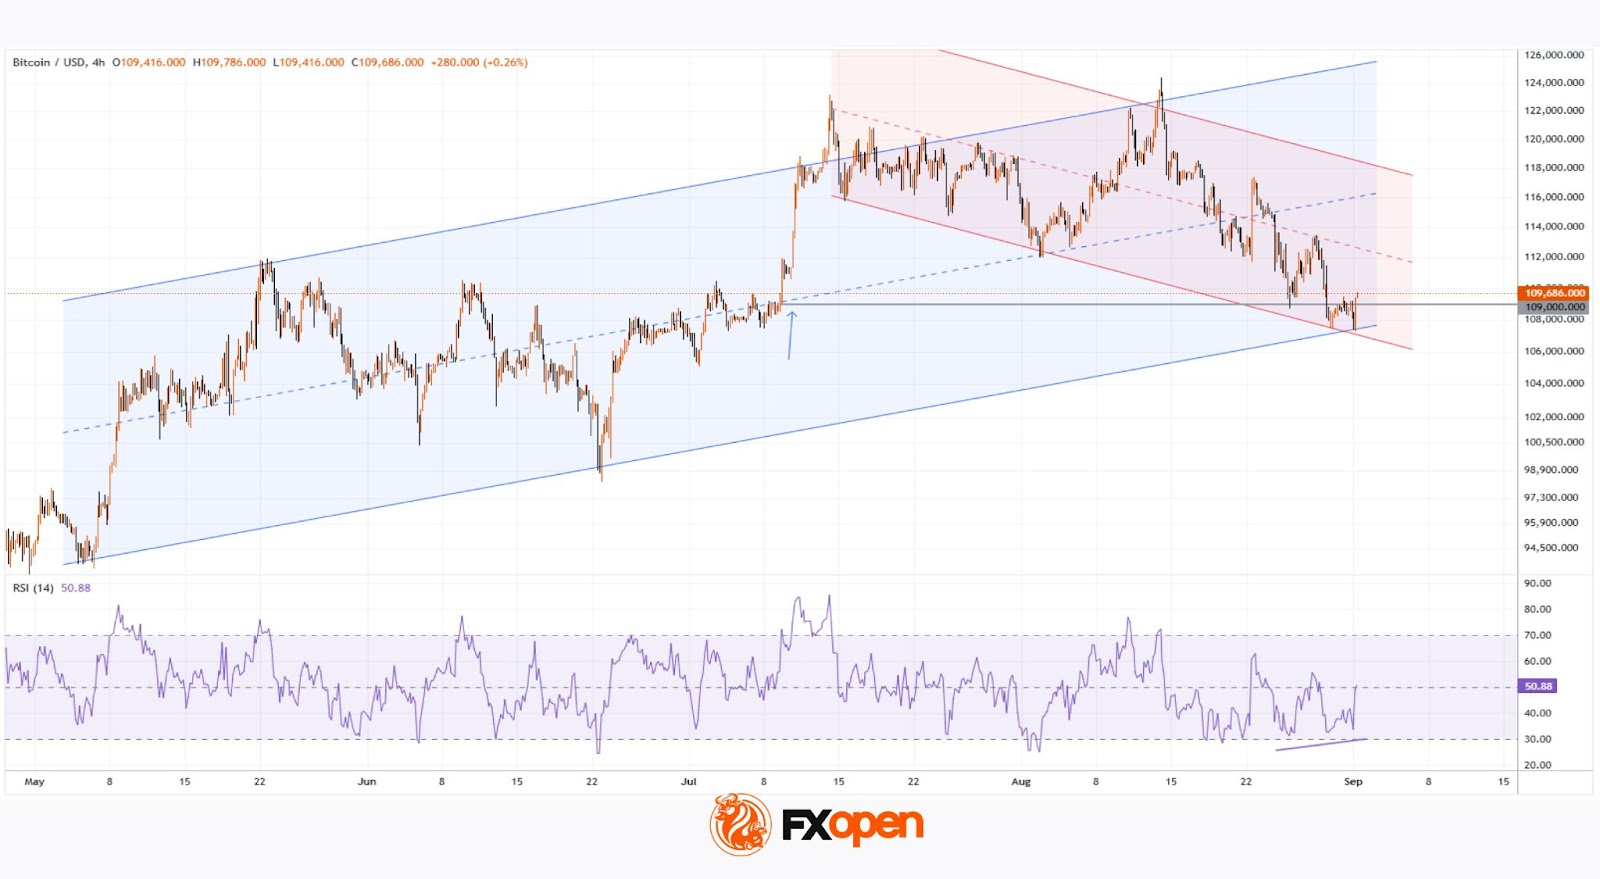
On 11 August, when analysing Bitcoin’s price, we extended the long-term upward channel (marked in blue) and suggested that the price might attempt to surpass its previous all-time high.
That expectation came true—but how might events unfold next?
While the upward blue channel (in place since spring 2025) remains valid, the chart also shows the outlines of a descending trajectory (marked in red)—a clear sign of bearish strength, with sellers demonstrating their ability to push prices down.
Attention should also be given to the $109k level. In mid-July, bears suffered a crushing defeat here, unable to counter a sharp rally (shown by the arrow). Therefore, we could expect some hesitancy from them around this area—something reflected in August price action:
→ On the 26th, the level acted as support.
→ On the 29th, bears managed to break through it.
→ Yet today, Bitcoin has climbed back above this level, forming a bullish double bottom pattern.
Given that the RSI indicator is showing a series of bullish divergences, and the lower boundary of the blue channel is reinforced by bullish price action near the $109k level, Bitcoin could remain within this multi-month channel. The next near-term target could be a recovery towards the median of the red channel.


